Mathematics AA SL IB Diploma Program - Topic 4: Statistics and Probability
17 views 1 purchase
Module
Math AA SL
Institution
Book
Oxford IB Diploma Programme: IB Mathematics: Analysis and Approaches, Standard Level, Print and Enhanced Online Course Book Pack
Detailed notes on topic 4: Statistics and probability of the IB diploma program mathematics analysis and approaches course. Includes worked examples and IB style questions.
Summary Oxford IB Diploma Programme: IB Mathematics: Analysis and Approaches, Standard Level, Print and Enhanced Online Course Book Pack - International Baccalaureate (IB)
Internal Assessment IB Diploma Mathematics A&A SL: Relationship between Different Cinematographical Factors and a Film's Opening Weekend Revenue
②
Population : an entire collection of individuals about which we want to draw conclusions .
②
Census : the collection of information from the whole population .
②
Sample : a subset of the population which should .
②
Survey : the collection of
information from a sample .
②
Data : information about individuals in a population .
②
Categorical variable ( qualitative) : describes a particular quality / characteristic which can be divided into categories .
②
Numerical variable ( quantitative) : describes a characteristic which has a numerical value which can be counted or measured .
Discrete numerical variable : exact number values → result of counting .
Continuous variable : values within certain result of measuring
→
a
range .
②
Parameter numerical quantity measuring aspect of the
:
a some population .
②
Statistic quantity calculated from the data gathered
:
from a sample → to estimate a
parameter .
②
Distribution the pattern of :
variation of data .
②
Outliers : data values that are either much
larger or much smaller than the
general body of data .
Frequency Tables
, Display of numerical data Histogram →
group variables
②
Column used to display discrete numerical variables
graphs are .
②
When data is recorded for continuous variable the data
a a
frequency histogram is used to display .
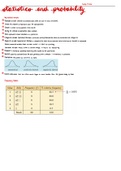
Exercise 23A
2. a. continuous variable .
b. Time 1min) Tally
0-9 1*1
10-19 1111/11*11*1
20-29 1*1111/111
30-39 111×1111
40 -49 111T I
c. positively skewed .
d. modal class : 10 -19min
Traveling time .
Measuring the center of data -
central tendency
Model discrete ) 1 Modal class ( continuous) : most frequently occurring value in the dataset .
Mean : statistical the arithmetic sum of all data values
name for average . mean =
the number of all data values
2 outliers use when
sy metrical
dataset present !
Median : middle value of an ordered dataset .
median = ntl
2
Exercise 2313.1
2. a. Mean dataset A : 6.46 b. Median data set A : 7 . c. The mean of dataset A is less than the mean of data set B.
Mean dataset B 6.85 : Median data set B : 7 .
since the Max value in dataset A is lower than the max value of
data set B.
d. The medians are the same for both datasets since 7- is
the middle value of the ordered dataset .
, Thursday ,
7- October
Standard Deviation 6)
On an how close are the individual values
average ,
µ=4 In A → list data points
9
InB→ list
frequency
36=3+0 tata +4+9+6 + a +3 Menu → 4( stats )
✗ = 5 4.2
16 Mean .
= median -_ 12 7- +9+111-13+14 +17+19+2/+12=12 1 Variable / 2 variable
9
n=9 21=6 =
name variables .
✗ → A
Mean Of
f- ✗
frequency distribution :
µ=
f-
The benefits of buying summaries with Stuvia:
Guaranteed quality through customer reviews
Stuvia customers have reviewed more than 700,000 summaries. This how you know that you are buying the best documents.
Quick and easy check-out
You can quickly pay through credit card for the summaries. There is no membership needed.
Focus on what matters
Your fellow students write the study notes themselves, which is why the documents are always reliable and up-to-date. This ensures you quickly get to the core!
Frequently asked questions
What do I get when I buy this document?
You get a PDF, available immediately after your purchase. The purchased document is accessible anytime, anywhere and indefinitely through your profile.
Satisfaction guarantee: how does it work?
Our satisfaction guarantee ensures that you always find a study document that suits you well. You fill out a form, and our customer service team takes care of the rest.
Who am I buying these notes from?
Stuvia is a marketplace, so you are not buying this document from us, but from seller LittleEinsteinTutors. Stuvia facilitates payment to the seller.
Will I be stuck with a subscription?
No, you only buy these notes for £5.14. You're not tied to anything after your purchase.