Hoofstuk 1 : kijken naar gegevens (data) & verdelingen (distributions)
1. Weergeven van verdelingen met grafieken
Data verkennen
De eerste stap die je moet zetten als je met data te maken krijt is die date te ‘verkennen’ .
Een exploratorische data-analyse is het proces waarbij statistische technieken en hulpmiddelen
worden gebruikt om data te onderzoeken en de kenmerken ervan na te gaan.
Data exploreren:
Begin met elke variabele apart te onderzoeken: centrale tendens (midden), spreiding,
uitschieters,…
Pas daarna wordt gekeken naar verbanden tussen variabelen
Begin met 1 of meerdere grafieken, daarna komen karakteristieke maten en cijfermatige
beschrijvingen aan bod
Variabelen
In een dataset staan voor de onderzochte cases ( deelnemers, analyse- eenheden) telkens
meetwaarden voor een of meerdere variabelen(kenmerken , eigenschappen, prestaties,…)
case = individu of groep individuen of object
o beschrijven aan de hand van data (=meetwaarden van variabelen)
variabele = geoperationaliseerd kenmerk van het individu
o categorische variabele : deelt het individu in een bepaalde categorie in
o kwantitatieve variabele : neemt numerische waarden aan waarop wiskundige
operaties zinvol mogelijk zijn.
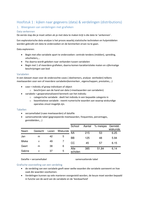
School Aantal % meisjes Gemidd.
wiskunde
Naam Geslacht Lezen Wiskunde
AA 215 53 6.25
Jan m 42 5
BB 125 48 5.94
Mieke v 49 7
CC 45 57 6.15
Geert m 38 6
Alle 385 51,84 6,14
Sabine v 37 5 scholen
Datafile = verzameltabel samenvattende tabel
Grafische voorstelling van een verdeling
de verdeling van een variabele geeft weer welke waarden die variabele aanneemt en hoe
vaak die waarden voorkomen.
Verdelingen kunnen op vele manieren voorgesteld worden, de keuze moet worden bepaald
in functie van de aard van de variabele en de ‘leesbaarheid’
The benefits of buying summaries with Stuvia:
Guaranteed quality through customer reviews
Stuvia customers have reviewed more than 700,000 summaries. This how you know that you are buying the best documents.
Quick and easy check-out
You can quickly pay through credit card for the summaries. There is no membership needed.
Focus on what matters
Your fellow students write the study notes themselves, which is why the documents are always reliable and up-to-date. This ensures you quickly get to the core!
Frequently asked questions
What do I get when I buy this document?
You get a PDF, available immediately after your purchase. The purchased document is accessible anytime, anywhere and indefinitely through your profile.
Satisfaction guarantee: how does it work?
Our satisfaction guarantee ensures that you always find a study document that suits you well. You fill out a form, and our customer service team takes care of the rest.
Who am I buying these notes from?
Stuvia is a marketplace, so you are not buying this document from us, but from seller jelkevandesijpe. Stuvia facilitates payment to the seller.
Will I be stuck with a subscription?
No, you only buy these notes for £3.46. You're not tied to anything after your purchase.