Strategic Position
UNIT 7
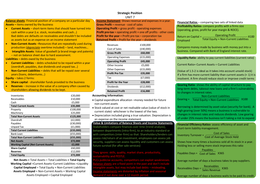
Balance sheets: Financial position of a company on a particular day Income Statement: Shows revenue and expenses in a year. Financial Ratios – comparing two sets of linked data
Assets – items owned by the business Gross Profit = revenue - cost of sales Profitability Ratios- compare profits with a firms size
Current Assets – short-term items that should have turned into Operating Profit = gross profit - operating expenses (operating, gross, profit for year margin & ROCE).
cash within a year (i.e. stock, receivables and cash…) Profit pre-tax = operating profit + one off profits - other costs
Bad debts are defaults on receivables and shouldn’t be included Profit for the year = Profit pre-tax – corporation tax Return on Capital = Operating Profit X100
as assets but as an expense on an income statement Retained Profit = Profit for the year – dividends Employed Total Equity + Non-Current Liabilities
Non-Current Assets –Resources that are repeatedly used during Revenues £100,000
production (depreciate overtime included) – land, machines… Compares money made by business with money put into a
Cost of Sales (£40,000)
Intangible Assets: Value of goodwill (a brand image and patents) Gross Profit £60,000
business. Compared with Bank of England interest rate.
– not on balance sheet due to hard assessment.
Operating Expenses (£15,000) Liquidity Ratio- ability to pay current liabilities (current ratio)
Liabilities – debts owed by the business
Operating Profit £45,000
Current Liabilities – debts scheduled to be repaid within a year
Other Income £5,000 Current Ratio= Current Assets ÷ Current Liabilities
(overdraft, payables, due dividends and unpaid tax…)
Other Expenses (£15,000)
Non-Current Liabilities – debts that will be repaid over several (Value of 1.5-2 is ideal as it takes into account unsold stock)
years (loans, debentures…) Profit Pre-Tax £35,000
If a firm has more current liability than current assets (< 1) it is
Equity – takes 2 forms: Tax (£7,000) insolvent. A firm should reduce stock or improve credit terms
Share capital - shareholder funds provided to the business Profit for the Year £28,000
Reserves – increase in the value of a company often caused by Gearing Ratio- shows the ability of capital structure to pay
Dividends (£12,000)
shareholders allowing dividends to be kept. long-term debts, takeout new loans and a firm’s vulnerability
Retained Profit £16,000
to changes in interest rates.
Inventories £20,000 Accounting information: Non-Current Liabilities
Receivables £10,000 Capital expenditure allocation –money needed for future Gearing = Total Equity + Non-Current Liabilities X100
Cash £5,000
non-current assets
Total Current Assets £35,000 Borrowing is determined by asset value (security for bank). A
Stock valued at cost or net realisable value (value of stock in
Property £100,000 high gearing (over 50%) means a business is vulnerable to
Machinery £25,000 current state)- whichever is the lowest of the two.
Depreciation included giving a true valuation. Depreciation is changes in interest rates and reduces dividends. Low gearing
Total Non-Current Assets £125,000
an expense on the income statement of under 25% means the business isn’t taking a risk to expand
Overdraft (£2,000)
Payables (£30,000) Value & Limitations of Balance Sheets and Income Statements Financial Efficiency Ratios- assess efficiency of asset and
Unpaid Tax (£1,000) Stakeholders compare finances over time (trend analysis), short-term liability management.
Total Current Liabilities (£33,000) between departments (intra-firm), to an industry standard or
Bank Loan (£55,000) with competitors (inter-firm) so that: Shareholders/lenders can Cost of Sales
Inventory Turnover =
Total Non-Current Liabilities (£55,000) assess risk/return of an investment, employees can assess job Cost of Average Stock Held
Net Assets £72,000 security, suppliers can assess liquidity and customers can assess Shows how many times a business sold all its stock in a year.
Working Capital (Net Current Assets) £2,000 future survival (for after sale services) Holding less or selling more stock improves this ratio
Share Capital £60,000
Reserves £12,000
Payables
They ignore: skills, quality, market share, productivity, Payables Days = Cost of Sales X365
Total Equity £72,000 sustainability and PESTLE.
Net Assets = Total Assets – Total Liabilities = Total Equity PLCs publicise accounts, competitors can exploit weaknesses. Average number of days a business takes to pay suppliers.
Working Capital =Current Assets–Current Liabilities =Liquidity Balance sheets are a fixed point in the past and don’t include
Capital Employed = Total Equity + Non-Current Liabilities intangible assets, but may include bad debts – misleading. Receivables
Receivables Days = X365
Assets Employed = Non-Current Assets + Working Capital Income statements are distorted by inflation and seasonal Sales Revenue
Assets Employed = Capital Employed demand if not done over a 12 month period. Average number of days a business waits to be paid its credit.