WGU C955 - Module 6: Correlation &
Regression Exam Questions and Answers
A researcher wants to know if there was a relationship between student age
and desire to complete a college degree. To answer this question, the
researcher used a local community college as the sampling frame and then
used stratified sampling to get a sample of students from 18 to 80 years old.
Based on the information given, is there any potential bias in this study?
a Yes, because the sampling frame does not match the intended population
of the question.
b Yes, because the sampling method will not give a representative sample.
c Yes, because a voluntary sample should have been used.
d No, there will likely be no bias in this study. - -Yes, because the sampling
frame does not match the intended population of the question.
-A researcher conducts an observational study and finds a correlation
between managers' income and the number of college credits earned. The
correlation coefficient was r=.85 with a regression equation of
y=515x+12000. What can you say about the relationship between these
variables?
a There is an association between these variables
b There is a causation between these variables.
c There is no relationship between these variables.
d There is not enough information to determine the relationship between the
variables. - -There is an association between these variables
-What technique is used to estimate the profit margin for a production level
of 25 thousand units, if a line of best fit is created to estimate profit margin
for production levels between 20 to 39 thousand units?
a Interpolation
b Linearization
c Extrapolation
d Internalization - -Interpolation
-What is the most appropriate definition of a scatterplot?
a A graph that uses dots to demonstrate relationships between two
categorical variables.
b A graph where lines are shown to represent positive or negative trends.
c A graph where the explanatory and response variables are plotted as
ordered pairs.
, d A graph where a positive causation is always represented with dots
forming a straight line. - -A graph where the explanatory and response
variables are plotted as ordered pairs.
-What does a strong positive correlation between two variables suggest?
a The explanatory variable is increasing and the response variable is
decreasing
b There is an association between the variables
c There is a causation between the variables
d Cannot determine - -There is an association between the variables
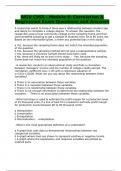
-{{ Scatterplot of distance from city center vs. rent. The linear equation for
this scatterplot is y equals negative one hundred five ten thousandths times
x plus ten and three hundred eighty one thousandths. }}
Using the scatterplot Distance from City Center vs. Monthly Rent, how far
can we expect an apartment to be from the city center if the monthly rent is
$ 980 ? Round your answer to the nearest mile.
a Around 54 miles
b Around 55 miles
c Around 56 miles
d Around 57 miles - -Around 55 miles
-Which correlation coefficient suggests the weakest correlation?
a −0.9
b −0.3
c 0.1
d 1 - -0.1
-What does it mean for a result or relationship to be statistically significant?
a The relationship is not caused by mere chance.
b The relationship is caused by chance.
c Your hypothesis test has failed.
d Your significance level is not high enough. - -The relationship is not caused
by mere chance.
-What is the process used to create the equation for the line of best fit?
a Completing the square
b Least squares estimation
c Fitting the line to the curve
d Linear approximation - -Least squares estimation
The benefits of buying summaries with Stuvia:
Guaranteed quality through customer reviews
Stuvia customers have reviewed more than 700,000 summaries. This how you know that you are buying the best documents.
Quick and easy check-out
You can quickly pay through credit card for the summaries. There is no membership needed.
Focus on what matters
Your fellow students write the study notes themselves, which is why the documents are always reliable and up-to-date. This ensures you quickly get to the core!
Frequently asked questions
What do I get when I buy this document?
You get a PDF, available immediately after your purchase. The purchased document is accessible anytime, anywhere and indefinitely through your profile.
Satisfaction guarantee: how does it work?
Our satisfaction guarantee ensures that you always find a study document that suits you well. You fill out a form, and our customer service team takes care of the rest.
Who am I buying these notes from?
Stuvia is a marketplace, so you are not buying this document from us, but from seller Victorious23. Stuvia facilitates payment to the seller.
Will I be stuck with a subscription?
No, you only buy these notes for £12.95. You're not tied to anything after your purchase.