Summary
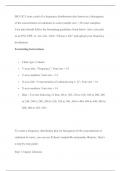
Summary BIO 182 Create a plot of a frequency distribution (also known as a histogram) of the conce
- Module
- Institution
BIO 182 Create a plot of a frequency distribution (also known as a histogram) of the conce BIO 182 Create a plot of a frequency distribution (also known as a histogram) of the concentration of cadmium in water (sample size = 20 water samples). Your plot should follow the formatting guidelines list...
[Show more]


