ECON0121 Final Coursework (60%)
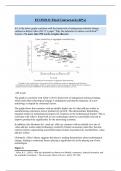
A1. Is the below graph consistent with the framework of endogenous technical change
outlined in Robert Allen (2011)1’s paper “Why the industrial revolution was British?”.
Explain. (No more than 250 words, Graphs allowed).
-249 words
The graph is consistent with Allen’s (2011) framework of endogenous technical change,
which states that technological change is endogenous and that the trajectory of a new
technology is shaped by contextual factors.
The graph shows that countries with an initially higher rate of value-add per worker in
manufacturing experience slower productivity growth. This demonstrates diminishing
marginal returns to technological progress for countries on the technological frontier. This is
consistent with Allen’s framework as new technologies must be contextually-relevant to
improve productivity significantly for the innovating economy.
In addition, this illustrates the ‘catch-up’ effect as countries with an initially low rate of
value-add per worker adopt technology created by frontier economies when they become
context-neutral, experiencing accelerated improvements in productivity and therefore, value-
add per worker.
Ultimately, Allen’s theory suggests that there is nothing deterministic about technological
change, leading to contextual factors playing a significant role in the playing out of new
technologies.
Figure 1:
1
Allen, R. C. (2011). Why the industrial revolution was British: commerce, induced invention, and
the scientific revolution 1. The Economic History Review, 64(2), 357-384.
, Source: Allen (2011)
In fact, Allen argues that the Industrial Revolution occurred in Britain because the
economical context demanded higher innovation, leading to mechanisation of the
manufacturing industry since Britain was richer than “follower” economies, e.g. wages were
5x more expensive relative to energy in Newcastle, compared to <1x in Paris and Beijing
(Figure 1). This increased incentives for labour-saving innovation, leading to mechanisation
through technological innovation. However, as these technologies became cheaper to
reproduce and “context-neutral”, followers caught up while productivity growth slowed in the
UK. Therefore, the graph is consistent with Allen’s (2011) paper.
A2. A scholar wants to conduct statistical research on the causal link between natural
resources and long-run economic growth. What variables would you recommend for
measuring natural resources? Explain the rationale behind your recommendations (No more
than 250 words, Graphs allowed).
-250 words
I would recommend using net resource exports per capita and resource rent per capita.
Net resource exports per capita reflects resource abundance more accurately than common
measures such as resource exports (% of GDP), used seminally by Sachs and Warner (1995)
(Hailu and Kipgen, 2017). This is because, while Sachs and Warner measure the scale of
resource exports (and thus, inferred resource abundance), net resource exports per capita
measures this relative to the value of resources imported and adjusts it for population. This is
a more precise measurement of the impact of resource extraction on each individual in the
country because it indicates the size of resource contributions to economic activity and per-
capita income. Using this, Norway, New Zealand, Finland, and Australia were ranked the
most resource-intensive economies rather than the DRC and Papua New Guinea, originally
found by Sachs and Warner (Lebdioui, 2021).
Figure 2 illustrates this:


