100% tevredenheidsgarantie Direct beschikbaar na betaling Zowel online als in PDF Je zit nergens aan vast
logo-home
Summary MVDA All Lectures Notes €5,99
In winkelwagen

Samenvatting

Summary MVDA All Lectures Notes

1 beoordeling
 18 keer bekeken  1 keer verkocht

All lecture notes and comments from the Multivariate Data Analysis course

Voorbeeld 4 van de 97  pagina's

  • 22 juni 2021
  • 97
  • 2020/2021
  • Samenvatting
Alle documenten voor dit vak (5)

1  beoordeling

review-writer-avatar

Door: anamaria5 • 2 jaar geleden

avatar-seller
gaiaantico
MDVA Lectures

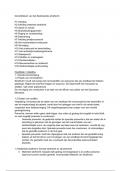
Lecture 1: Multiple Regression Analysis (MRA)

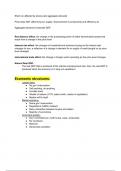
Research Questions

Examples:

- Can depression in dutch adults be predicted from life events and coping?
- Do teaching methods have an effect on arithmetic performance of middle class
children?

Above research questions have two components:

● Specific relationship between constructs (what we want to investigate)
● A population of interest (sample ---> testing ---> generalise)

To test a research question (for a population):

● Take a sample from the population of interest
● Measure the relevant constructs
- Data are called variables (e.g. depression, life events, coping)
● Apply appropriate statistical technique to answer question
- This course on MVDA

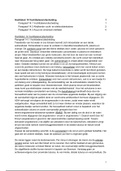
Univariate ---> relationship between 2 variables (e.g. age and income)
Multivariate ---> relationship between 3 or more variables
- Dynamics between 3 variables are more complex than between 2

Techniques Weeks 1 to 4

Data in weeks 1 to 4
● 1 dependent variable Y
● Several independent variables X1, X2, … (predictors)

Research question
● Can Y be predicted from X1 and/or X2?

Which technique depends on measurement level of variables

3 levels of measurement are relevant (in this course):

● NOM: Nominal level - only distinguishes categories
- E.g. no therapy, psycho-dynamic, exposure

● INT: Interval level - if intervals meaningful / order
- E.g. weights, height, IQ score, BDI score (quasi-interval)

, ● BIN: Binary variables - has 2 categories (can be NOM or INT)
- E.g. pass / fail, male / female


X1, X2 Y Technique Abbreviation

INT INT Multiple regression Analysis MRA

NOM INT Analysis of variance ANOVA

NOM + INT INT Analysis of covariance ANCOVA

INT BIN Logistic regression analysis LRA


Remarks
● X1, X2 can also be BIN
● If Y is BIN, then we have to use LRA


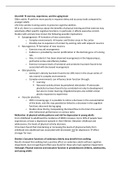
Introduction

Multiple Regression Analysis (MRA)

Measurement levels:
● Dependent variable Y is INT
● Independent variables X1, X2 are INT

1) Illustrative (fictional) example

Health psychologist:
Can depression (Y) be predicted from life events (X1 and/or coping (X2)?

Psychologist conducts a study with 60 dutch adults

, - Asks participant about number of life events
- Uses test to measure coping index of participant
- Uses Beck Depression Inventory (BDI) to measure depression

All variables are INT
- Number of life events (0,1,2,3,...): e.g. financial difficulties, relationship troubles,
disease, etc.
- Coping index (1 = no coping, 10 = good coping)
- BDI score (0-9 minimal, 10-18 mild, 19-29 moderate, 30-63 severe depression)

2) Regression model

Can Y be predicted from X1 and/or X2? (Y, X1, X2 = INT)

Model that works really well:
Dependent variable Y is a linear function of predictors X1 and X2 (can be described by a
straight line)

Regression model
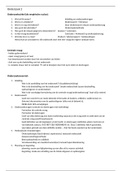
● Simple regression: Yi = b*0 + b*1 X1i + ei
● Multiple regression: Yi = b*0 + b*1 X1i + b*2 X2i + … + b*k Xki + ei

Where
● b*0 is the (population) regression constant
● b*1, b*2 and b*k are (population) regression coefficients
● X1i, X2i, Xki and Yi are the scores on X1, X2, Xk and Y of individual i
● ei is a residual (= error)

The parameters b*0, b*1, b*2 and b*k need to be estimated from the data (sample)
Linear Model: least squares estimation (e.g. SPSS)

Fit a Line

Linear model with one predictor

Simple regression - fit a straight line through a set of data points
- Each participant is a point
- Slope (the way it points upwards or downwards) is the regression coefficient
- If 0 the line would be flat, if positive (+) the line would slope up, if negative (-) the line
would slope down

, Regression Equation

Let Ŷi denote the prediction of Yi

Relationship: Ŷi = Ŷi + ei (actual data = regression model (what we think it should be) + error)

Regression equation:
● Simple regression: Ŷi = b0 + b1 X1i
● Multiple regression: Ŷi = b0 + b1 X1i + b2 X2i + … bk Xki
Where
● b0, b1, b2 and bk are estimate of b*0, b*1, b*2 and b*k

Best prediction (least squares) if the sum of squared differences is minimal


(Actual score of participant - predicted score of participant)²

Regression Line

With one predictor - regression line

Voordelen van het kopen van samenvattingen bij Stuvia op een rij:

Verzekerd van kwaliteit door reviews

Verzekerd van kwaliteit door reviews

Stuvia-klanten hebben meer dan 700.000 samenvattingen beoordeeld. Zo weet je zeker dat je de beste documenten koopt!

Snel en makkelijk kopen

Snel en makkelijk kopen

Je betaalt supersnel en eenmalig met iDeal, creditcard of Stuvia-tegoed voor de samenvatting. Zonder lidmaatschap.

Focus op de essentie

Focus op de essentie

Samenvattingen worden geschreven voor en door anderen. Daarom zijn de samenvattingen altijd betrouwbaar en actueel. Zo kom je snel tot de kern!

Veelgestelde vragen

Wat krijg ik als ik dit document koop?

Je krijgt een PDF, die direct beschikbaar is na je aankoop. Het gekochte document is altijd, overal en oneindig toegankelijk via je profiel.

Tevredenheidsgarantie: hoe werkt dat?

Onze tevredenheidsgarantie zorgt ervoor dat je altijd een studiedocument vindt dat goed bij je past. Je vult een formulier in en onze klantenservice regelt de rest.

Van wie koop ik deze samenvatting?

Stuvia is een marktplaats, je koop dit document dus niet van ons, maar van verkoper gaiaantico. Stuvia faciliteert de betaling aan de verkoper.

Zit ik meteen vast aan een abonnement?

Nee, je koopt alleen deze samenvatting voor €5,99. Je zit daarna nergens aan vast.

Is Stuvia te vertrouwen?

4,6 sterren op Google & Trustpilot (+1000 reviews)

Afgelopen 30 dagen zijn er 53068 samenvattingen verkocht

Opgericht in 2010, al 14 jaar dé plek om samenvattingen te kopen
Start met verkopen
€5,99  1x  verkocht
  • (1)
In winkelwagen
Toegevoegd