100% tevredenheidsgarantie Direct beschikbaar na betaling Zowel online als in PDF Je zit nergens aan vast
logo-home
Financial Econometrics €8,59   In winkelwagen

College aantekeningen

Financial Econometrics

 151 keer bekeken  8 keer verkocht
  • Vak
  • Instelling

FR2202 Financial Econometrics Notes, for City University London students, contain an overview of every topic covered within the module. Summarised into a 16-page single document, the notes were prepared using both lecture notes, in-class discussions and core textbook (ISBN: 6823) This lecture n...

[Meer zien]
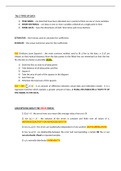
Voorbeeld 3 van de 16  pagina's

  • 22 juli 2021
  • 16
  • 2014/2015
  • College aantekeningen
  • N/a
  • Alle colleges
avatar-seller
The 3 TYPES OF DATA:

1) TIME SERIES – are data that have been allocated over a period of time on one or more variables
2) CROSS-SECTIONAL – are data on one or more variables collected at a single point in time
3) PANEL DATA – have the dimensions of both Time Series and Cross-Sections


ESTIMATOR – the formula used to calculate the coefficients

ESTIMATE – the actual numerical value for the coefficients


OLS (Ordinary Least Squares) – the most common method used to fit a line to the data. α & β are
chosen so that vertical distances from the data points to the fitted line are minimized (so that the line
fits the data as closely as possible) STEPS:

1) Draw the line as close to all data points
2) Take distance of all data points and line
3) Square it
4) Take the area of each of the squares in the diagram
5) Sum them up
6) Minimize the total sum of the squares

RSS = SSR (∑ u^ 2 t ) - is an amount of difference between actual data and estimation model. It is a
regression function which explains a greater amount of data. A SMALL RSS INDICATES A TIGHT FIT OF
THE MODEL TO THE DATA.


ASSUMPTIONS ABOUT THE ERROR TERMS:

1) E(ut) = 0 - the errors have zero mean (the average value of errors is 0)

2) Var (ut) = σ2 - the variance of the errors is constant and finite over all values of x t
(HETEROSCEDASTICITY OR HOMOSCEDASTICITY)

3) Cov (ui,uj)=0 - the errors are statistically independent of one another (AUTOCORRELATION)

4) Cov (ut,xt)=0 - no relationship between the error and corresponding x variate OR the x’s are
non-stochastic /fixed in repeated samples

5) ut is normally distributed (NORMALITY)

,If assumptions 1 through 4 hold, then the estimators α^ and ^β determined by OLS are known as BEST
LINEAR UNBIASED ESTIMATORS (BLUE) and hypothesis tests regarding coefficient estimates (βs) can be
validly conducted.


PROPERTIES OF THE OLS ESTIMATOR:

• BEST - means that the OLS estimator ^β has minimum variance among the class of linear unbiased
estimators.

• LINEAR –α^ and ^β are linear estimators

^ and ^β will be equal to the true values
• UNBIASED - on average, the estimated values of the α

^ and ^β are estimators of the true value of α and β
• ESTIMATOR - α

SIMPLE linear regression model yt = α + βxt + ut that has been derived above, together with the
assumptions listed above, is known as the CLASSICAL LINEAR REGRESSION MODEL (CLRM).


Under these 4 assumptions, the OLS estimator can be:
- CONSISTENT – the least square estimators α^ and ^β are consistent. For an infinite number of
observations, the probability of the estimator being different from the true value is zero. If an
estimator is inconsistent, then even if we had an infinite amount of data, we could not be sure that
the estimated value will be close to its true value. The estimates will converge to their true values as
the sample size increases to infinity. That is, ^β → β as n → ∞
- UNBIASED – the least square estimates of α ^ and ^β are unbiased. That is E(α^ )= α and E( ^β )= β . Thus
on average the estimated values for the coefficients will be equal to their true values. Unbiasedness
is a stronger condition than consistency, since it holds for small as well as large samples. But not all
unbiased estimators are consistent. An unbiased estimator is consistent if its variance falls as the
sample size increases
- EFFICIENT – an estimator ^β of parameter β is said to be efficient if it is unbiased and no other
estimator has a smaller variance. If the estimator is efficient, we are minimizing the probability that
it is a long way off from the true value of β


yt – regressand, effect variable, explained variable, dependent variable
xt – regressor, causal variable, explanatory variable, independent variable
ut – error, residual, disturbance, noise

, SE – is A MEASURE OF RELIABILITY OR precision of the estimators ( α^ and ^β ). It is useful to know whether
one can have confidence in the estimates, and whether they are likely to vary much from one sample to
another within the given population. If the SE is small, it shows that the coefficients are likely to be
precise on average, NOT how precise they are for this particular sample. THE LOWER IT IS, THE BETTER
(means it is getting precise). IT IS LOWER WHEN: the sample size is large and when RSS (=SSR) is large

^ ) and SE ( ^β ) are the standard errors (OR standard deviation) of the coefficient estimates
SE(α

∑ u^ 2 t . THE SMALLER IT IS,
SE of the SIMPLE regression model OR the variance of the error (s) =

THE CLOSER IS THE FIT OF THE LINE TO THE ACTUAL DATA.
√ T −2


2 WAYS of conducting a HYPOTHESIS TEST:

H0: (no correlation between ‘x’ and ‘y’ – BAD NEWS!!!)

^β−β *
1) TEST OF SIGNIFICANCE approach = t T −2
SE( β^ )
Significance level N(0,1)
50% 0
5% 1.64
2.5% 1.96
0.5% 2.57
2) CONFIDENCE INTERVAL approach

If the β * lies within the confidence interval, ACCEPT H 0!!!


NOTE: If we reject the null hypothesis at the 5% level, we say that the result of the test is statistically
significant. We usually reject the null hypothesis if the test statistic is statistically significant at a
chosen significance level.

Voordelen van het kopen van samenvattingen bij Stuvia op een rij:

Verzekerd van kwaliteit door reviews

Verzekerd van kwaliteit door reviews

Stuvia-klanten hebben meer dan 700.000 samenvattingen beoordeeld. Zo weet je zeker dat je de beste documenten koopt!

Snel en makkelijk kopen

Snel en makkelijk kopen

Je betaalt supersnel en eenmalig met iDeal, creditcard of Stuvia-tegoed voor de samenvatting. Zonder lidmaatschap.

Focus op de essentie

Focus op de essentie

Samenvattingen worden geschreven voor en door anderen. Daarom zijn de samenvattingen altijd betrouwbaar en actueel. Zo kom je snel tot de kern!

Veelgestelde vragen

Wat krijg ik als ik dit document koop?

Je krijgt een PDF, die direct beschikbaar is na je aankoop. Het gekochte document is altijd, overal en oneindig toegankelijk via je profiel.

Tevredenheidsgarantie: hoe werkt dat?

Onze tevredenheidsgarantie zorgt ervoor dat je altijd een studiedocument vindt dat goed bij je past. Je vult een formulier in en onze klantenservice regelt de rest.

Van wie koop ik deze samenvatting?

Stuvia is een marktplaats, je koop dit document dus niet van ons, maar van verkoper nmn82. Stuvia faciliteert de betaling aan de verkoper.

Zit ik meteen vast aan een abonnement?

Nee, je koopt alleen deze samenvatting voor €8,59. Je zit daarna nergens aan vast.

Is Stuvia te vertrouwen?

4,6 sterren op Google & Trustpilot (+1000 reviews)

Afgelopen 30 dagen zijn er 80189 samenvattingen verkocht

Opgericht in 2010, al 14 jaar dé plek om samenvattingen te kopen

Start met verkopen
€8,59  8x  verkocht
  • (0)
  Kopen