100% tevredenheidsgarantie Direct beschikbaar na betaling Zowel online als in PDF Je zit nergens aan vast
logo-home
Summary Statistics 2 €5,14
In winkelwagen

Samenvatting

Summary Statistics 2

 58 keer bekeken  6 keer verkocht

This summary covers a recapitulation of Statistics 1 and covers the whole course of Statistics 2. Besides explanation of the topics, this summary also contains examples of statistical experiments and dives deep into explaining data interpretation. The statistical jargon/terminology needed to under...

[Meer zien]
Laatste update van het document: 2 jaar geleden

Voorbeeld 3 van de 33  pagina's

  • 16 mei 2022
  • 21 juni 2022
  • 33
  • 2021/2022
  • Samenvatting
Alle documenten voor dit vak (1)
avatar-seller
StephSilentium
Statistics

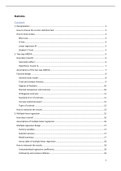
Content
1. Recapitulation ..................................................................................................................................... 3
How to choose the correct statistical test: ......................................................................................... 3
How to look at data: ............................................................................................................................ 4
Effect size......................................................................................................................................... 4
X² test .............................................................................................................................................. 4
Linear regression R² ......................................................................................................................... 5
Student’s T-test ............................................................................................................................... 5
2. Two-way ANOVA ................................................................................................................................. 6
How does it work? ............................................................................................................................... 6
Interaction effect ............................................................................................................................. 6
Hypothesis: H0 and Ha ...................................................................................................................... 7
Assumptions of the two-way ANOVA.................................................................................................. 7
Factorial design ................................................................................................................................... 8
General linear model: ...................................................................................................................... 8
Total and residual Variance ............................................................................................................. 9
Degrees of freedom....................................................................................................................... 10
Planned comparison and contrasts ............................................................................................... 10
Orthogonal contrasts..................................................................................................................... 11
Standard error of contrasts ........................................................................................................... 11
Increase statistical power .............................................................................................................. 12
Types of contrast ........................................................................................................................... 12
How to interpret the results.............................................................................................................. 13
3. Multiple linear regression ................................................................................................................. 15
How does it work? ............................................................................................................................. 16
Assumptions of multiple linear regression........................................................................................ 16
Multiple regression design ................................................................................................................ 17
Dummy variables ........................................................................................................................... 17
Selection process ........................................................................................................................... 17
Model summary ............................................................................................................................ 17
Anova table of multiple linear regression ..................................................................................... 18
How to interpret the results.............................................................................................................. 18
Unstandardized regression coefficients ........................................................................................ 18
Collinearity and variance inflation................................................................................................. 19


1

, Stepwise regression: entering predictors...................................................................................... 19
Backward elemination ................................................................................................................... 21
Forward selection .......................................................................................................................... 21
4. Power analysis and sample size determination ................................................................................ 21
B.E.A.N.S ............................................................................................................................................ 21
β, Type-2 error probability ............................................................................................................ 22
Effect size....................................................................................................................................... 22
α significance level, type-1 error ................................................................................................... 23
n; sample size ................................................................................................................................ 24
S, Standard deviation, variability, σ............................................................................................... 24
Increasing statistical power ............................................................................................................... 24
5. Bayesian inference ............................................................................................................................ 25
Null hypothesis testing ...................................................................................................................... 25
Bayesian hypothesis testing .............................................................................................................. 25
Priors in Bayesian analysis ................................................................................................................. 26
How to interpreted the results.......................................................................................................... 27
Bayes factor ................................................................................................................................... 27
Using a priori belief ....................................................................................................................... 27
Beta distribution 𝐵(𝛼, 𝛽) ............................................................................................................... 29
6. Meta-analysis .................................................................................................................................... 30
Funnel plots ....................................................................................................................................... 30
Forest plots ........................................................................................................................................ 31
Heterogeneity.................................................................................................................................... 32
Meta-analysis in steps ....................................................................................................................... 33


2

, 1. Recapitulation
How to choose the correct statistical test:


The independent variable is the cause. Its value is independent of other variables in your study.
The dependent variable is the effect. Its value depends on changes in the independent variable.

Qualitative research is expressed in words. It is used to understand concepts, thoughts or
experiences. This type of research enables you to gather in-depth insights on topics that are not well
understood.

Nominal data is labelled into mutually exclusive categories within a variable. These
categories cannot be ordered in a meaningful way. Like way of transport: bus, train, bike, car.

Ordinal data is classified into categories within a variable that have a natural rank order.
However, the distances between the categories are uneven or unknown. For example, the
variable “frequency of physical exercise” can be categorized into the following:

1. Never 2. Rarely 3. Sometimes 4. Often 5. Always


Quantitative research is expressed in numbers and graphs. It is used to test or confirm theories and
assumptions. This type of research can be used to establish generalizable facts about a topic.

Discrete variables represent counts (e.g. the number of objects you count in a variable).

Continuous variables represent measurable amounts (e.g. water volume or weight)


3

Voordelen van het kopen van samenvattingen bij Stuvia op een rij:

Verzekerd van kwaliteit door reviews

Verzekerd van kwaliteit door reviews

Stuvia-klanten hebben meer dan 700.000 samenvattingen beoordeeld. Zo weet je zeker dat je de beste documenten koopt!

Snel en makkelijk kopen

Snel en makkelijk kopen

Je betaalt supersnel en eenmalig met iDeal, creditcard of Stuvia-tegoed voor de samenvatting. Zonder lidmaatschap.

Focus op de essentie

Focus op de essentie

Samenvattingen worden geschreven voor en door anderen. Daarom zijn de samenvattingen altijd betrouwbaar en actueel. Zo kom je snel tot de kern!

Veelgestelde vragen

Wat krijg ik als ik dit document koop?

Je krijgt een PDF, die direct beschikbaar is na je aankoop. Het gekochte document is altijd, overal en oneindig toegankelijk via je profiel.

Tevredenheidsgarantie: hoe werkt dat?

Onze tevredenheidsgarantie zorgt ervoor dat je altijd een studiedocument vindt dat goed bij je past. Je vult een formulier in en onze klantenservice regelt de rest.

Van wie koop ik deze samenvatting?

Stuvia is een marktplaats, je koop dit document dus niet van ons, maar van verkoper StephSilentium. Stuvia faciliteert de betaling aan de verkoper.

Zit ik meteen vast aan een abonnement?

Nee, je koopt alleen deze samenvatting voor €5,14. Je zit daarna nergens aan vast.

Is Stuvia te vertrouwen?

4,6 sterren op Google & Trustpilot (+1000 reviews)

Afgelopen 30 dagen zijn er 51036 samenvattingen verkocht

Opgericht in 2010, al 15 jaar dé plek om samenvattingen te kopen

Start met verkopen
€5,14  6x  verkocht
  • (0)
In winkelwagen
Toegevoegd