Met deze aantekeningen worden alle onderdelen benoemd van het vak. Hoe je bepaalde onderwerpen moet berekenen en maken. Dit vak maakt deel uit van het tentamen praktijk als procesverbeteraar. In deze aantekening bevinden zich de hoofdstukken 5 Probability Distribution, H12 Quality and Six Sigma A...
Statistiek module PAP
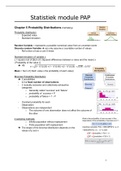
Chapter 5 Probability Distributions (herhaling)
Probability distribution
- Expected value
- Standard deviation
Random Variable = represents a possible numerical value from an uncertain event
Discrete random Variable can only assume a countable number of values
- Roll a dice or toss a coin 5 times
Standard deviation of variable σ
σ = square root of [Sum of ( Squared differences between a value and the mean) x
( Probability of the value )]
VB σ (0 1)2 (0.25) (1 1)2 (0.50) (2 1)2 (0.25) 0.50 0.707
Mean = Sum of [ Each value x the probability of each value]
Binomial Probability Distribution
2 possibilities
- n = a fixed number of observations
- 2 mutually exclusive and collectively exhaustive
categories
o Generally called “success” and “failure”
o probability of success = P
o probability of failure = 1 - P
- Constant probability for each
Observation
- Observations are independent
o The outcome of one observation does not affect the outcome of
the other
2 sampling methods:
o Infinite population without replacement
o Finite population with replacement
The shape of the binomial distribution depends on the
values of p and n
1
, Poisson Probability Distribution: (Waiting Lines)
Hele getallen, minder dan 30 stuks, “area of opportunity”
- Apply this when:
o You wish to count the number of times an event occurs in a given area of
opportunity
o The probability that an event occurs in 1 area of opportunity is the same for all
areas of opportunity
o The number of events that occur in1 area of opportunity is independent of the
number of events that occur in the other areas of opportunity
o The probability that 2 or more events occur in an area of opportunity
approaches 0 as the area of opportunity becomes smaller
λ= The average number of events per unit
Continuous Probability
Distribution
- Continuous random variable = variable
that can assume any value on a continuum (can assume an uncountable number of
values)
o Thickness of an item
o Time required to complete a task
o Temperature of a solution
o Height, in inches
- These can potentially take on any value depending only on the ability to measure
accurately
Normal Distribution (alle andere getallen)
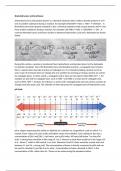
Changing μ shifts the distribution left or right
Changing σ increases or decreases the spread
The Standardized Normal:
- Any normal distribution (with any mean and standard deviation combination) can
be transformed into the standardized normal distribution (Z)
- Need to transform X units into Z units
The Z distribution always has a mean = 0 and standard deviation =1
2
Voordelen van het kopen van samenvattingen bij Stuvia op een rij:
Verzekerd van kwaliteit door reviews
Stuvia-klanten hebben meer dan 700.000 samenvattingen beoordeeld. Zo weet je zeker dat je de beste documenten koopt!
Snel en makkelijk kopen
Je betaalt supersnel en eenmalig met iDeal, creditcard of Stuvia-tegoed voor de samenvatting. Zonder lidmaatschap.
Focus op de essentie
Samenvattingen worden geschreven voor en door anderen. Daarom zijn de samenvattingen altijd betrouwbaar en actueel. Zo kom je snel tot de kern!
Veelgestelde vragen
Wat krijg ik als ik dit document koop?
Je krijgt een PDF, die direct beschikbaar is na je aankoop. Het gekochte document is altijd, overal en oneindig toegankelijk via je profiel.
Tevredenheidsgarantie: hoe werkt dat?
Onze tevredenheidsgarantie zorgt ervoor dat je altijd een studiedocument vindt dat goed bij je past. Je vult een formulier in en onze klantenservice regelt de rest.
Van wie koop ik deze samenvatting?
Stuvia is een marktplaats, je koop dit document dus niet van ons, maar van verkoper lieker. Stuvia faciliteert de betaling aan de verkoper.
Zit ik meteen vast aan een abonnement?
Nee, je koopt alleen deze samenvatting voor €3,99. Je zit daarna nergens aan vast.