Statistic Ib Chapter 15.1 – 15.2
15.1 Nonparametric Tests
Introduction
We assume that the data have a Normal Distribution (in
practice no distribution is exactly Normal)
Our methods for inference about population means are quite
robust
Robust – the results of inference are not very sensitive to
moderate lack of normality, especially when the samples are
reasonably large
What can we do when the population distribution is clearly not
Normal?
o If lack of Normality is due to outliers, remove the
outliers. If the outlier appears to be “real data,” use
more resistant inference of statistics like x́ and s
o Sometimes we can transform our data so that their
distribution is more nearly Normal
o Other standard distributions?
o Modern bootstrap methods and permutation tests do not
require Normality or any specific form of sampling
distribution
o Other nonparametric methods that do not require any
specific form for the distribution of the population
Sign test – works with counts of observations
Rank tests – based on ranks of each observation
Rank tests that are designed to replace t test and one-way
analysis of variance when the Normality conditions for those
tests are not met
All ran test require that the population or populations have
continuous distributions
o That is, each distribution must be described by a density
curve that allows observations to take any value in
some interval of outcomes
Figure 15.1
When distributions are strongly skewed, we often prefer the
median to the mean as a measure of center
, 15.1 The Wilcoxon Rank Sum Test
Two-sample problems – 7.2
The rank transformation
We first rank all observation together, arrange them in order
form smallest to largest
Ranks – to rank observations, first arrange them in order from
smallest to largest
o The rank of each observation is its position in this
ordered list, starting with rank 1 for the smallest
observation
The rank transformation retains only the ordering of the
observations and makes no other is of their numerical values
Working with ranks allows us to dispense with specific
assumptions about the shape of the distribution, such as
Normality
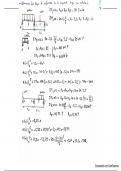
The Wilcoxon rank sum test
Draw an SRS of size n1 from one population and draw an
independent SRS of size n2 from a second population. There
are N observations in all, where N=n1+ n2 . Rank all N
observations. The sum W of the ranks for the first sample is
the Wilcoxon rank sum statistic. If the two populations have
the same continuous distribution, then W has mean
n ( N +1)
μW = 1
2 √ n n (N +1)
and standard deviation σ W = 1 2
12
The Wilcoxon rank sum test rejects the hypothesis that the
two populations have identical distributions when the rank
sum W is far from its mean
To calculate the p-value we need to know the sampling
distribution of the rank sum W when the null hypothesis is
true
The Normal approximation
The rank sum statistic W becomes approximately Normal as
the two sample size increase, we can form another z statistic
by standardizing W:
W −μW
z=
σW
W −n1 ( N +1)/2
¿
√n1 n2 ( N +1)/12
Use standard Normal probability calculations to find p-values
for this statistic, b/c W takes only whole-number values, the
15.1 Nonparametric Tests
Introduction
We assume that the data have a Normal Distribution (in
practice no distribution is exactly Normal)
Our methods for inference about population means are quite
robust
Robust – the results of inference are not very sensitive to
moderate lack of normality, especially when the samples are
reasonably large
What can we do when the population distribution is clearly not
Normal?
o If lack of Normality is due to outliers, remove the
outliers. If the outlier appears to be “real data,” use
more resistant inference of statistics like x́ and s
o Sometimes we can transform our data so that their
distribution is more nearly Normal
o Other standard distributions?
o Modern bootstrap methods and permutation tests do not
require Normality or any specific form of sampling
distribution
o Other nonparametric methods that do not require any
specific form for the distribution of the population
Sign test – works with counts of observations
Rank tests – based on ranks of each observation
Rank tests that are designed to replace t test and one-way
analysis of variance when the Normality conditions for those
tests are not met
All ran test require that the population or populations have
continuous distributions
o That is, each distribution must be described by a density
curve that allows observations to take any value in
some interval of outcomes
Figure 15.1
When distributions are strongly skewed, we often prefer the
median to the mean as a measure of center
, 15.1 The Wilcoxon Rank Sum Test
Two-sample problems – 7.2
The rank transformation
We first rank all observation together, arrange them in order
form smallest to largest
Ranks – to rank observations, first arrange them in order from
smallest to largest
o The rank of each observation is its position in this
ordered list, starting with rank 1 for the smallest
observation
The rank transformation retains only the ordering of the
observations and makes no other is of their numerical values
Working with ranks allows us to dispense with specific
assumptions about the shape of the distribution, such as
Normality
The Wilcoxon rank sum test
Draw an SRS of size n1 from one population and draw an
independent SRS of size n2 from a second population. There
are N observations in all, where N=n1+ n2 . Rank all N
observations. The sum W of the ranks for the first sample is
the Wilcoxon rank sum statistic. If the two populations have
the same continuous distribution, then W has mean
n ( N +1)
μW = 1
2 √ n n (N +1)
and standard deviation σ W = 1 2
12
The Wilcoxon rank sum test rejects the hypothesis that the
two populations have identical distributions when the rank
sum W is far from its mean
To calculate the p-value we need to know the sampling
distribution of the rank sum W when the null hypothesis is
true
The Normal approximation
The rank sum statistic W becomes approximately Normal as
the two sample size increase, we can form another z statistic
by standardizing W:
W −μW
z=
σW
W −n1 ( N +1)/2
¿
√n1 n2 ( N +1)/12
Use standard Normal probability calculations to find p-values
for this statistic, b/c W takes only whole-number values, the