TASK 4 – MEASURING AND IMAGING THE BRAIN
Extra resource used: Kolb & Whishaw (2013)
Single-cell recording
In single-cell recording, an electrode is inserted directly into the brain adjacent to a single
neuron, recording the neuron’s electrical activity on a computer, then correlating the activity
with ongoing behavior. Experiments with various animal species can reveal remarkable
insights into what single neurons are up to, measuring an action potential. Disadvantage is
that it is invasive and not generalizable. In practice, it is mostly applied to epileptic patients.
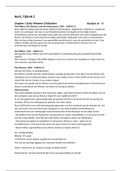
The figure illustrates the different graphic representations that can be obtained by changing
the time base. In graph A, only an action potential can be graphed. In graph B, which
represents 3 ms, a couple of action potentials can be graphed. Graph C represents a longer
period, during which many action potentials are graphed.
Electroencephalographic recording
Recording of voltage fluctuations or ‘brain waves’ are called electroencephalograms
(EEGs) and are a valuable tool for studying sleep, monitoring the depth of anaesthesia,
diagnosing epilepsy and brain damage, and studying normal brain function.
To establish EEGs, macroelectrodes
(in stead of microelectrodes) are used,
which do not detect activity of
individual neurons, but the
postsynaptic potentials of many
thousands/millions of cells in the area
of the electrode.
In a typical EEG recording arrangement, one electrode (the active electrode) is attached to
the scalp to detect the electrical activity in the underlying brain area. A second electrode (the
indifferent electrode) is attached to the ear lobe, where there is no electrical activity to
detect. The two electrodes detect the difference in the electrical potentials.
, PSY/IPN1023 Body and Behavior
What does EEG record? Individual neurons produce graded potentials – small depolarizations
and hyperpolarizations. If a large number of neurons undergo graded potential changes of the
same charge at the same time, the signal is large enough to be recorded from as far away as
the skull. A substantial part of the EEG signal comes from the large pyramidal neurons of
layers V and VI in the neocortex. So-called pacemaker cells ensure that these neurons
undergo graded potentials at the same time, presumably so they can synchronize their action
potentials.
Magnetoencephalography
When a magnetic field passes across a wire, it induces a current in the wire. When a current
flows along a wire, it induces a magnetic field around the wire. This reciprocal relation
between electricity and magnetism is also seen in neurons. Neural activity, by generating an
electrical field, also produces a magnetic field. The field produced by many neurons is
sufficiently strong to be recorded on the surface of the skull; such a record is called a
magnetoencephalogram (MEG), and is the magnetic counterpart of the EEG.
Calculations based on MEG measures not only provide a description of the electrical activity
of neurons but also permit a three-dimensional localization of the cell groups generating the
measured field. Magnetic waves being conducted
through living tissue undergo less distortion that
electrical signals do, and so an MEG can have a
higher resolution than an EEG. Thus, a major
advantage of MEG over EEG is its ability to more
precisely identify the source of activity being
recorded. This also brings a disadvantage; the
equipment for producing MEG is expensive in
comparison to EEG.
Computerized tomography (CT)
In computerized tomography (CAT or CT), X-
ray energy is used to generate images. In a CT
scanner, an X-ray source is moved by steps in an
arc round the head. At each point, detectors on
the opposite side of the head measure the
amount of X-ray radiation that is absorbed; this
value is proportional to the density of the tissue.
When this process is repeated from many angles
and the results are mathematically combined, an
anatomical map of the brain based on tissue
density can be generated by computer. CT scans
are medium resolution images, useful for
visualizing problems such as strokes or tumors.
In CT scans, the skull is seen as a white border. The density of the brain’s gray matter does
not differ sufficiently from that of white matter for a CT scan to clearly distinguish between
the two, and so the cortex and its underlying white matter show up as more or less
homogenous gray. Ventricles can be visualized because the fluid in them is far less dense. The
major fissures are rendered darker in the CT scan.


