Lecture 6 - Tests & Null hypotheses
Confidence interval
Confidence → denotes how certain we are that our estimates will really hold true for the
population.
Precision → refers to how close our estimate is to the true population characteristic
Precision level → desired max size of the estimating interval; sample statistic - population
parameter.
More precision, more confidence, or both can be achieved by increasing our sample size. However
time or budget constraints, for instance, might not allow us to increase the sample size. So there is
a trade-off: if you can’t increase the sample size (n), the only way to maintain the same level of
precision is to forsake (abandon) the confidence.
Testing for significance
Statistical significance is determined by looking at the p-value. The p-value gives the probability of
observing the test results under the null hypothesis. Thus, a low p-value indicates decreased
support for the null hypothesis, which would eventually result in rejecting the null hypothesis.
The significance level for a given hypothesis test (α) is a value for which P-value should be less or
equal to in order to be considered as statistically significant.
● Typical values for α are 0.1, 0.05, and 0.01.
Example
1
, This table indicates that the regression model predicts the dependent variable significantly well.
How do we know this? Look at the "Regression" row and go to the "Sig." column. This indicates
the statistical significance of the regression model that was run. Here, p = 0.000 which is < than
0.05, and indicates that, overall, the regression model statistically significantly predicts the
outcome variable (i.e., it is a good fit for the data). Thus, you reject the null hypothesis.
When do you reject, or do not reject
Reject the null hypothesis if p < α
● reject the null hypothesis if p < 0.05 (the
alpha is usually given)
● Rejecting the null hypothesis means that
the test is significant.
○ your results are significant enough
to accept1 the alternative
hypothesis
Do not reject the null hypothesis if p > α
Type I and type II error explained
In both types of error, the test results of a
research do not match the reality (but in
different ways).
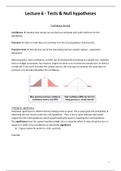
Type I error → occurs when we believe that
there is a genuine effect in our population
based on our data, when in fact there isn’t.
Type II error → occurs when we believe that
there is no effect in the population based on
our data, when in fact there is.
An example to compare type I and type II error
1
Don’t ever use the term ‘accept’ on your exam, Always write ‘reject’ or ‘do not reject the null hypotheses. If
you use ‘accepts’, teachers deduct points even though your answer is correct.’
2