100% tevredenheidsgarantie Direct beschikbaar na betaling Zowel online als in PDF Je zit nergens aan vast
logo-home
Statistics summary €5,99
In winkelwagen

Samenvatting

Statistics summary

1 beoordeling
 377 keer bekeken  15 keer verkocht

This is a summary of all the material covered in "Introduction to statistics" and "MTO-B". This bundle includes all the topics, worked out and examples of each test done. I passed Introduction to statistics with a 10. Every test has a nice overview within a table, so you can easily study the theor...

[Meer zien]
Laatste update van het document: 5 jaar geleden

Voorbeeld 4 van de 67  pagina's

  • Onbekend
  • 5 juni 2019
  • 8 juni 2019
  • 67
  • 2018/2019
  • Samenvatting
book image

Titel boek:

Auteur(s):

  • Uitgave:
  • ISBN:
  • Druk:
Alles voor dit studieboek (2)
Alle documenten voor dit vak (7)

1  beoordeling

review-writer-avatar

Door: hehevelke • 5 jaar geleden

avatar-seller
ernanihazbolatow123
MTO-B | Introduction to Statistics @ Tilburg University
By: Ernani Hazbolatow

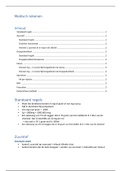
Table of content
Variables
Descriptive statistics
Probabilities
Sampling assumptions
Distributions
Introduction and Fundamental steps of NHST
Philosophy of NHST
Theoretical explanation of all NHSTs
Statistical dependency
Hypothesis testing with Statistical dependency
Examples of NHSTs
Examples of Chi2 tests
SPSS examples

, MTO-B | Introduction to Statistics @ Tilburg University
Laying the basis for NHST
Alternatively, Variables, Descriptive Statistics, and Probabilities


Table of content
Variables
Descriptive statistics
Probabilities
Sampling assumptions
Distributions

,Chapter 1 | Variables
1.1 Introduction
Random variable ​is a variable whose possible outcomes are the result of a random phenomenon
● Notation: Typically X, or Y
○ For specific outcomes: x or y
● The measurement level of a variable indicates what meaning the numbers convey.
● Two types: Discrete and Continuous


1.2 Types of random variables
Indeed, we have two types of variables:
● Discrete (random variables)
○ Possible outcomes that the variable takes on comes from a specified finite,
countable list of values.
○ Measurement level​: Nominal/ordinal variables are generally discrete.
● However​! Discrete variables are not always nominal/ordinal.
○ Examples​: Number of children in a family, Categories
● Continuous (random variables)
○ Possible outcomes the variable takes on can be any value within a certain interval (which could also be
–infinity to infinity).
● What kind of values? 1.1, 1.11, 1.11
● Hence:​ The number of values variable can have are infinite
○ Measurement level​: Typically have interval/ratio levels.
● However​! Not all interval/ratio variables are continuous.
○ Examples​: Height, Dosage, ml of alcohol consumed


1.3 Measurement level of a random variable
The measurement level of a random variable​ determines which analyses you should​ perform. There are 4 levels, which are
cumulative. This means that each level also has the properties of the previous levels:
● Nominal variables/Categorical variable
1. Assign mutually exclusive numbers to the outcomes
● Ordinal variables
1. Assign mutually exclusive numbers to the outcomes
2. There is a meaningful ordering in the outcomes
● Interval variables
1. Assign mutually exclusive numbers to the outcomes
2. There is a meaningful ordering in the outcomes
3. The intervals between each the ordered outcomes are meaningful and the same size.
● Ratio variables
1. Assign mutually exclusive numbers to the outcomes
2. There is a meaningful ordering in the outcomes
3. The intervals between each the ordered
outcomes are meaningful and the same size.
4. “Absolute zero point”: A zero means that
there is an absence of that variable.

, Chapter 2 | Descriptive Statistics
2.1 Introduction
We use descriptive statistics to summarizing variables and their probability distributions in a few numbers. There are two types:
● Central tendency measures
○ Describes the ​center ​or typical value of a variable
○ Types​: Mean, Median, and Mode
● Dispersion measures
○ Describes the ​variation​, spread, or dispersion in scores
○ Types​: Range, variance and standard deviation


2.2 Central tendency measures
In total, we have 3 central tendency measures:
● Median:​ The outcome separating the upper half from the lower half of a data when data is ordered from high to low
○ When the ​number of outcomes is an even number:​ Two numbers will represent the upper and lower half
the data. ​Hence​, we add them up and divide them by 2, to get the real midpoint.
● Mode:​ The outcome that occurs most often (Alternatively, the outcome with the highest frequency)
● Mean​: The central outcome of our observations.
○ Notation: μ for pop., ​x̄ for sample
○ Steps to calculate the mean:
1. Add up the values of all our observations for our variable X (ΣX)
2. Get the total number of observations, we call that number N (for pop.) or n (for sample)
3. Divide the sum of our observations from step 1 by the total number of observations from
step 2

2.3 ​Dispersion measures
In total, we have 3 dispersion measures:
● Range:​ The difference between the variable’s largest and smallest outcome when data is ordered from
high to low
● Variance:​ The average squared deviation from the mean
○ Notation: σ² for pop., s² for sample
○ What if we don't square our differences? We square to get rid of negative numbers. If we don’t,
all of our observations add up to 0 (which has no use for us).
● For those who think that taking the absolute value of our difference is a possibility:
THIS IS BEING DEBATED
○ Note​: There’s a difference with the pop. and sample calculation. ​The sample uses n-1 for the
number of observations​, in order to take in account ​degrees of freedom​.
● Standard deviation ​is the variance but expressed in similar numbers as our data. (Alternatively, Standard
deviation is the average deviation from the mean).
○ Hence​: To get to the standard deviation, we remove the square by the square root of the
variance.
○ Notation: σ for pop, s for sample

Voordelen van het kopen van samenvattingen bij Stuvia op een rij:

Verzekerd van kwaliteit door reviews

Verzekerd van kwaliteit door reviews

Stuvia-klanten hebben meer dan 700.000 samenvattingen beoordeeld. Zo weet je zeker dat je de beste documenten koopt!

Snel en makkelijk kopen

Snel en makkelijk kopen

Je betaalt supersnel en eenmalig met iDeal, creditcard of Stuvia-tegoed voor de samenvatting. Zonder lidmaatschap.

Focus op de essentie

Focus op de essentie

Samenvattingen worden geschreven voor en door anderen. Daarom zijn de samenvattingen altijd betrouwbaar en actueel. Zo kom je snel tot de kern!

Veelgestelde vragen

Wat krijg ik als ik dit document koop?

Je krijgt een PDF, die direct beschikbaar is na je aankoop. Het gekochte document is altijd, overal en oneindig toegankelijk via je profiel.

Tevredenheidsgarantie: hoe werkt dat?

Onze tevredenheidsgarantie zorgt ervoor dat je altijd een studiedocument vindt dat goed bij je past. Je vult een formulier in en onze klantenservice regelt de rest.

Van wie koop ik deze samenvatting?

Stuvia is een marktplaats, je koop dit document dus niet van ons, maar van verkoper ernanihazbolatow123. Stuvia faciliteert de betaling aan de verkoper.

Zit ik meteen vast aan een abonnement?

Nee, je koopt alleen deze samenvatting voor €5,99. Je zit daarna nergens aan vast.

Is Stuvia te vertrouwen?

4,6 sterren op Google & Trustpilot (+1000 reviews)

Afgelopen 30 dagen zijn er 53249 samenvattingen verkocht

Opgericht in 2010, al 14 jaar dé plek om samenvattingen te kopen

Start met verkopen
€5,99  15x  verkocht
  • (1)
In winkelwagen
Toegevoegd