Advanced Quantitative Research Methods
Lecture 1 – Introduction
• Quantitative research quantifies relationships between observable measures of a
theoretical construct
• Example: Using Heart Rate, Blood Pressure, and self-reported stress surveys to
measure the construct cardiovascular health or stress
• This sounds vague…but life is chaotic
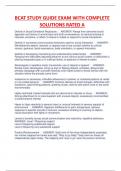
Nomological networks
•
•
Introduction to quantitative research
• Theoretical construct: The construct you want to measure (e.g., age, stress, sleep
quality)
• Measure: the construct you want to measure (e.g., age, stress, sleep quality)
• Operationalisation: Translation of a somewhat vague construct to a precise
measurement (e.g., how, what, why, type, scale)
• Variable: Outcome of applying the measure, the actual ‘data’ (e.g., heart rate, hapiness
score)
• Q: Which of the following is a measure? (A)Heart rate b) Stress level c) Pittsburg Sleep
Questionnaire d) Question type)1
1 Answer: c) Pitssburgh Sleep Questionnaire
1
,Scales
• Nominal: Categorical variables where order makes no sense
o Type of transport, mood, breakfast
• Ordinal: Categorical variables where order makes (some) sense
o Income levels, pain intensity, (Likert scales)
• Interval: No natural zero value, but differences make sense
o The zero is a starting point, but it doesn't mean there's none of something; it's
more of a benchmark.
o Temperature, IQ scores, pH levels, (Likert scales)
• Ratio: Natural zero value. Ratios and differences make sense
o The zero means there's none of something, and you can also compare amounts
and see how many times one amount is bigger than another.
o Heart rate, respiration, blood pressure
• Q: I measure your level of attention using the duration (in seconds) you look at your
phone instead of me. What scale does my variable have?2
Variables
• Various types:
o Continuous: Can also have a value between two other values
o Discrete: Only distinct values are possible
• Various roles:
o Independent: Predictors; X; the ‘knobs’ used to explain
o Dependent: Outcome; Y; the observed variable to explain
Quality
• How precise are our measurements? (i.e., how reliable/consistent?)
• How accurate are our measurements? (i.e., how valid?)
• High reliability but low validity = bad (Headsize to measure intelligence)
• Low reliability but high validity = bad (Scale 0-10, how happy are you right now?)
• High reliability and high validity = good! (Balanced and validated questionnaire for sleep
quality, PSQI)
• Reliability (precise)
o Test-retest: If repeated later, do we get the same answer?
o Inter-rater: If repeated for someone else, do we get the same answer?
o Parallel forms: If repeated across theoretically equivalent but different
measurements, do we get the same answer?
o Internal consistency: Do the different parts of a questionnaire agree with each
other?
• Q: I measure my stress level using a self-reported survey with multiple questions. I do
this twice using different survey’s. What type(s) of reliability are assessed here?3
• Validity (accuracy)
o Many types
o Construct validity: To what extent do the measurements allow us to make
conclusions about the theoretical construct?
2 Ratio
3 Parallel forms and internal consistency
2
, ▪ High validity example: Continuous report of affect
▪ Low validity example: HR to estimate stress
o Ecological validity: To what extent do the conclusions generalize to real-world
situations?
▪ High validity example: TIHM dataset (recorded at home)
▪ Low validity example: CASE dataset (recorded in restricted lab setting)
• Threats to validity
o Confound: Additional unmeasured variable related to the predictors and
outcomes
o Artifact: Special situation during your study that limits generalizability
o Many types of confounds and artifacts…
o History effects: Specific (historic) events occured that influence outcomes
o Maturational effects: People age, getting bored, tired, etc…
o Repeated testing: People learn and practice, getting familiar
o Selection bias: Treatment and control group have different characteristics
o Non-response bias: People responding have more in common than random
o Experimenter bias: Asking specific questions, signaling desired behaviour
o Demand effects: The fact that people know they are part of an experiment can
influence their behavior or responses.
o Placebo effects: Control group shows effect
o Fraud, deception, self-deception, etc…: Researcher dishonesity
• Ultimate goal of good research design: Maximise validity and reliability by minimizing
threats.
3
, Lecture 2 – Parametric vs Non-Parametric tests (1/3)
Statistical inference
• You are a teacher at Hogwarts. You want to know what percentage of students can
perform a Patronus charm to adapt your lectures.
• You have a population.
• You have a parameter you want to know.
• You need to take a sample of Hogwarts students to estimate the variable.
• How do you know if the estimation for the parameter you get from the sample is
accurate for the whole population?
o → Statistical inference: infer properties (draw conclusions) from a sample
about the population
• Greek letters = population; normal alphabet = sample
Parametric vs non parametric tests
• Statistical tests: parametric or non-parametric?
• Parametric tests assume a specific distribution for the data of the population.
• Parametric tests are more powerful when these assumptions are met. Non-
parametric tests are more robust when these assumptions are violated.
4
Lecture 1 – Introduction
• Quantitative research quantifies relationships between observable measures of a
theoretical construct
• Example: Using Heart Rate, Blood Pressure, and self-reported stress surveys to
measure the construct cardiovascular health or stress
• This sounds vague…but life is chaotic
Nomological networks
•
•
Introduction to quantitative research
• Theoretical construct: The construct you want to measure (e.g., age, stress, sleep
quality)
• Measure: the construct you want to measure (e.g., age, stress, sleep quality)
• Operationalisation: Translation of a somewhat vague construct to a precise
measurement (e.g., how, what, why, type, scale)
• Variable: Outcome of applying the measure, the actual ‘data’ (e.g., heart rate, hapiness
score)
• Q: Which of the following is a measure? (A)Heart rate b) Stress level c) Pittsburg Sleep
Questionnaire d) Question type)1
1 Answer: c) Pitssburgh Sleep Questionnaire
1
,Scales
• Nominal: Categorical variables where order makes no sense
o Type of transport, mood, breakfast
• Ordinal: Categorical variables where order makes (some) sense
o Income levels, pain intensity, (Likert scales)
• Interval: No natural zero value, but differences make sense
o The zero is a starting point, but it doesn't mean there's none of something; it's
more of a benchmark.
o Temperature, IQ scores, pH levels, (Likert scales)
• Ratio: Natural zero value. Ratios and differences make sense
o The zero means there's none of something, and you can also compare amounts
and see how many times one amount is bigger than another.
o Heart rate, respiration, blood pressure
• Q: I measure your level of attention using the duration (in seconds) you look at your
phone instead of me. What scale does my variable have?2
Variables
• Various types:
o Continuous: Can also have a value between two other values
o Discrete: Only distinct values are possible
• Various roles:
o Independent: Predictors; X; the ‘knobs’ used to explain
o Dependent: Outcome; Y; the observed variable to explain
Quality
• How precise are our measurements? (i.e., how reliable/consistent?)
• How accurate are our measurements? (i.e., how valid?)
• High reliability but low validity = bad (Headsize to measure intelligence)
• Low reliability but high validity = bad (Scale 0-10, how happy are you right now?)
• High reliability and high validity = good! (Balanced and validated questionnaire for sleep
quality, PSQI)
• Reliability (precise)
o Test-retest: If repeated later, do we get the same answer?
o Inter-rater: If repeated for someone else, do we get the same answer?
o Parallel forms: If repeated across theoretically equivalent but different
measurements, do we get the same answer?
o Internal consistency: Do the different parts of a questionnaire agree with each
other?
• Q: I measure my stress level using a self-reported survey with multiple questions. I do
this twice using different survey’s. What type(s) of reliability are assessed here?3
• Validity (accuracy)
o Many types
o Construct validity: To what extent do the measurements allow us to make
conclusions about the theoretical construct?
2 Ratio
3 Parallel forms and internal consistency
2
, ▪ High validity example: Continuous report of affect
▪ Low validity example: HR to estimate stress
o Ecological validity: To what extent do the conclusions generalize to real-world
situations?
▪ High validity example: TIHM dataset (recorded at home)
▪ Low validity example: CASE dataset (recorded in restricted lab setting)
• Threats to validity
o Confound: Additional unmeasured variable related to the predictors and
outcomes
o Artifact: Special situation during your study that limits generalizability
o Many types of confounds and artifacts…
o History effects: Specific (historic) events occured that influence outcomes
o Maturational effects: People age, getting bored, tired, etc…
o Repeated testing: People learn and practice, getting familiar
o Selection bias: Treatment and control group have different characteristics
o Non-response bias: People responding have more in common than random
o Experimenter bias: Asking specific questions, signaling desired behaviour
o Demand effects: The fact that people know they are part of an experiment can
influence their behavior or responses.
o Placebo effects: Control group shows effect
o Fraud, deception, self-deception, etc…: Researcher dishonesity
• Ultimate goal of good research design: Maximise validity and reliability by minimizing
threats.
3
, Lecture 2 – Parametric vs Non-Parametric tests (1/3)
Statistical inference
• You are a teacher at Hogwarts. You want to know what percentage of students can
perform a Patronus charm to adapt your lectures.
• You have a population.
• You have a parameter you want to know.
• You need to take a sample of Hogwarts students to estimate the variable.
• How do you know if the estimation for the parameter you get from the sample is
accurate for the whole population?
o → Statistical inference: infer properties (draw conclusions) from a sample
about the population
• Greek letters = population; normal alphabet = sample
Parametric vs non parametric tests
• Statistical tests: parametric or non-parametric?
• Parametric tests assume a specific distribution for the data of the population.
• Parametric tests are more powerful when these assumptions are met. Non-
parametric tests are more robust when these assumptions are violated.
4