100% tevredenheidsgarantie Direct beschikbaar na betaling Zowel online als in PDF Je zit nergens aan vast
logo-home
ARMS Grasple aantekeningen + SPSS output voor het SPSS-tentamen €4,99
In winkelwagen

Overig

ARMS Grasple aantekeningen + SPSS output voor het SPSS-tentamen

2 beoordelingen
 237 keer bekeken  18 keer verkocht

Alle theorie die behandeld is in SPSS voor ARMS! Hierin staan ook tabellen van SPSS en alle stappen die je moet uitvoeren voor elke analyse. Ook heb ik extra informatie uit de lessen en van het internet toegevoegd om het duidelijker te maken. Indien je dit document leest hoef je de Grasple less...

[Meer zien]
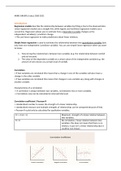
Voorbeeld 4 van de 41  pagina's

  • 10 maart 2021
  • 41
  • 2020/2021
  • Overig
  • Onbekend
Alle documenten voor dit vak (19)

2  beoordelingen

review-writer-avatar

Door: lotteroosbrouwer • 3 jaar geleden

review-writer-avatar

Door: nanda_vanveen • 3 jaar geleden

avatar-seller
dk24
ARMS GRASPLE notes 2020-2021


Introduction
Regression models describe the relationship between variables by fitting a line to the observed data.
Linear regression models use a straight line, while logistic and nonlinear regression models use a
curved line. Regression allows you to estimate how a dependent variable changes as the
independent variable(s) / predictor change.
-> We use linear regression to make predictions about linear relations.

Simple linear regression is used to estimate the relationship between two quantitative variables (you
only have one independent / predictor variable). You can use simple linear regression when you want
to know:

1. How strong the relationship is between two variables (e.g. the relationship between rainfall
and soil erosion).
2. The value of the dependent variable at a certain value of the independent variable (e.g. the
amount of soil erosion at a certain level of rainfall).


Correlation
= If two variables are correlated this means that a change in one of the variables will also mean a
change in the other variable.
= If two variables are correlated this means that changes in one variable vary along with changes in
another variable.

Characteristics of a correlation
-> A correlation is always between two variables, not between less or more variables.
-> Correlations only can be calculated at interval/ratio level.


Correlation coefficient / Pearson R
= standardized number to assess the strength of a linear relationship.
= standardized measure and multiple strengths of relationships can be compared because of that.
= Pearson R could only be calculated for qualitative variables.

R = +1 (or -1) Maximum strength of a linear relation between
two variables.
R=0 No correlation / linear relation between two
variables: this does not mean that there is no
relation, it just isn’t a linear relationship (but it
could be non-linear).

,Correlation is not the same as causation
A Correlation does not mean that the movement in one variable causes the other variable to move as
well. Correlation suggests an association between two variables: If two variables are correlated,
this means that changes in one variable vary along with changes in another variable. Causality shows
that one variable directly effects a change in the other. Although correlation may imply causality,
that’s different than a cause-and-effect relationship. See below.


Linear regression


1. Intercept (b0): the point where the regression line crosses the Y-axis
2. Slope (b1): if X increases by 1, how much does Y increases?
^ above Y means: it is not the observed Y-value but the predicted one.
If the X-value is zero, the Y-value is the same as the intercept. In this
example: if X = zero, Y is 40 because the intercept is 40.


SPSS-output for another example
Estimated intercept = 49.050
Slope = 3.466

,Error = residual


Residual = observed data – predicted data (fitted value)

We check for the line with the smallest possible sum of squared errors: we can find a linear
regression model which fits the data best.
= least square method.
-> this method is used for to estimate the parameters of the linear regression model. When we
square the errors, they will always be positive and they do not cancel each other. This way we can
look for the line that will result in the smallest possible sum of squared errors.


Goodness of fit
= how well the fit of the prediction (independent variable) is.
For example: R-squared

R-squared
= proportion of variance of the response variable that is explained by the predictor variable / the
model.
-> Value between 0 and 1.

If the R-squared is very small, this If the R-squared is very large, this
does not mean that there is no meaningful does not mean that the model is useful for
relationship between the two variables. The predicting new observations.
relationship could still be practically relevant, A very large R-squared could be due to the
even though it does not explain a large amount sample, and might not predict well in a
of variance. different sample.

-> the large R-squared can be caused by the
specific sample.


R-squared in the SPSS-output below = 8.3%

, Week 1 Linear Regression
Assumptions before performing a multiple regression
1. Measurement level
One condition for a multiple regression is that the dependent variable is a continuous measure
(interval/ratio). The independent variable / predictor should be continuous or dichotomous (nominal
with two categories. For example: gender, male = 1, female = 0).
2. Linearity
Second condition for the multiple regression is that there are linear relationships between the
dependent variable and all continuous independent variables.
-> you should make a scatterplot of each IV and the DV to check whether the relationship is linear. If
it is, it is possible to include this variable as an independent variable within the analysis.
3. Absence of outliers.
-> check this assumption with a scatterplot.
-> if there is an outlier, remove it from the data set.
-> produce a new scatterplot and compare the old and the new one.
-> if you compare both scatterplots and it is not possible to say whether the relationship is stronger
or weaker (with or without outlier), it is also possible to check the value of the R-squared: if it is
larger, the relationship is stronger.


Explained variance by the
model (the IV) with outlier.


Explained variance by the
model (the IV) without
outlier.

Voordelen van het kopen van samenvattingen bij Stuvia op een rij:

Verzekerd van kwaliteit door reviews

Verzekerd van kwaliteit door reviews

Stuvia-klanten hebben meer dan 700.000 samenvattingen beoordeeld. Zo weet je zeker dat je de beste documenten koopt!

Snel en makkelijk kopen

Snel en makkelijk kopen

Je betaalt supersnel en eenmalig met iDeal, creditcard of Stuvia-tegoed voor de samenvatting. Zonder lidmaatschap.

Focus op de essentie

Focus op de essentie

Samenvattingen worden geschreven voor en door anderen. Daarom zijn de samenvattingen altijd betrouwbaar en actueel. Zo kom je snel tot de kern!

Veelgestelde vragen

Wat krijg ik als ik dit document koop?

Je krijgt een PDF, die direct beschikbaar is na je aankoop. Het gekochte document is altijd, overal en oneindig toegankelijk via je profiel.

Tevredenheidsgarantie: hoe werkt dat?

Onze tevredenheidsgarantie zorgt ervoor dat je altijd een studiedocument vindt dat goed bij je past. Je vult een formulier in en onze klantenservice regelt de rest.

Van wie koop ik deze samenvatting?

Stuvia is een marktplaats, je koop dit document dus niet van ons, maar van verkoper dk24. Stuvia faciliteert de betaling aan de verkoper.

Zit ik meteen vast aan een abonnement?

Nee, je koopt alleen deze samenvatting voor €4,99. Je zit daarna nergens aan vast.

Is Stuvia te vertrouwen?

4,6 sterren op Google & Trustpilot (+1000 reviews)

Afgelopen 30 dagen zijn er 48298 samenvattingen verkocht

Opgericht in 2010, al 15 jaar dé plek om samenvattingen te kopen

Start met verkopen
€4,99  18x  verkocht
  • (2)
In winkelwagen
Toegevoegd