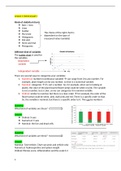
This summary contains 7 data analysis lessons given on the HAN in Nijmegen (). This course was about plant- and microbiology, not to be confused with the immune- and histology data analysis lessons. This summary is 16 pages long and contains several assignments
Kinds of statistical charts
v Bars / rows
v Lines
v Scatter
The choice of the right chart is
v Pie/circle
dependent on the type of
v Histograms
measured value (variable)
v Dot plot
v Stem-and-leaf
v Pictograms
Different kind of variables
The scatter chart is used for
the variables
Dependent
variable
Independent variable
There are second ways to categorize your variables:
1. Numerical: numbers (continuous variable) can range from 0 to any number. For
example, plant length can be any number, so that is a numerical variable
2. Nominal: categories it’s not a number. So, for example, when we’re looking at
plants; the color of the plant leaves/flower petal could be white or pink. The variable
is not a number, but a color, so we can categorize it in nominal variable
3. Ordinal: similar to nominal, but there is a clear order for example, the color of the
flower petal could be white, pink, dark pink and red. There is a specific order to that.
So, the variable is nominal, but there is a specific order to it. This can be numbers
Question
What kind of variables are these?
Answer
v Ordinal: X-axis
v Numerical: Y-axis
v Nominal: the live and dead cells
Question
What kind of variables are these?
Answer
Nominal: TAA+vehicle, TAA+curcumin and vehicle only
Numerical: hydroxyproline and spleen weight
Ordinal: fibrosis score, inflammation and the scale 0-3
1
,Average :
ΣX
X=
n
X =average
X =all the results
n=number of measurements
Standard deviation (SD)
2
Σni=1 ( X i− X )
SD=standard deviation
SD=
√ n−1
X i =measurement value
X =average of measurements
n=number of measurements
Measures of spread
v SD
v Variance
Standard error of the mean (SEM)
no measure of the spread of the values
gives information about the average
Standard deviation
v SD = square root of the average of the squared distance to the average (how far
away the values are with regard to the mean)
v Excel: “=STDEV.S”
o There are 2 types in excel “.S” means sample. “.P” means population
Variance
v Variance = average of the squared distance to the average
v Mainly used for specific statistical analyses (like ANOVA)
n 2
Σ X −X)
v SD 2= i=1 ( i
n−1
v Excel: “=VAR.S”
Standard error of the mean (SEM)
v SEM =SD/ √ n
v Excel: you make use of the aforementioned formula (there is no special operator for
this)
v In some cases, it’s being used in scientific publication (error bars in charts)
v Estimation of the distance between your sample average and the population average
v The SEM becomes smaller as the number of measurements increases
v The lower the SEM, the better
2
, Question
Calculate the average and SD of the following data
Answer
Σ X 20+15+18+19+ 22+ 20
Average: = =19
n 6
SD:
How do we record that?
v 19 ± 2.4 cm
v What can we use is for?
See graph
The black line is called the error bar. It indicates the spread (SD)
How to make a bar chart?
Steps Results
1. Calculate the average and SD of the
data you want to make a bar chart of
2. To make it a bit clearer, copy the
results in a different section (not
needed)
3. Plot the chart
4. Add the error bars and select
“Custom” and click on “Specify
value”.
5. Then, select all SD values at the
positive and negative error values.
Add a title to the chart and to the x-
3
Voordelen van het kopen van samenvattingen bij Stuvia op een rij:
Verzekerd van kwaliteit door reviews
Stuvia-klanten hebben meer dan 700.000 samenvattingen beoordeeld. Zo weet je zeker dat je de beste documenten koopt!
Snel en makkelijk kopen
Je betaalt supersnel en eenmalig met iDeal, creditcard of Stuvia-tegoed voor de samenvatting. Zonder lidmaatschap.
Focus op de essentie
Samenvattingen worden geschreven voor en door anderen. Daarom zijn de samenvattingen altijd betrouwbaar en actueel. Zo kom je snel tot de kern!
Veelgestelde vragen
Wat krijg ik als ik dit document koop?
Je krijgt een PDF, die direct beschikbaar is na je aankoop. Het gekochte document is altijd, overal en oneindig toegankelijk via je profiel.
Tevredenheidsgarantie: hoe werkt dat?
Onze tevredenheidsgarantie zorgt ervoor dat je altijd een studiedocument vindt dat goed bij je past. Je vult een formulier in en onze klantenservice regelt de rest.
Van wie koop ik deze samenvatting?
Stuvia is een marktplaats, je koop dit document dus niet van ons, maar van verkoper wendiy. Stuvia faciliteert de betaling aan de verkoper.
Zit ik meteen vast aan een abonnement?
Nee, je koopt alleen deze samenvatting voor €4,99. Je zit daarna nergens aan vast.