100% tevredenheidsgarantie Direct beschikbaar na betaling Zowel online als in PDF Je zit nergens aan vast
logo-home
Summary Statistics Stenden University Year 2 International Hospitality Management €2,99
In winkelwagen

Samenvatting

Summary Statistics Stenden University Year 2 International Hospitality Management

5 beoordelingen
 1526 keer bekeken  38 keer verkocht

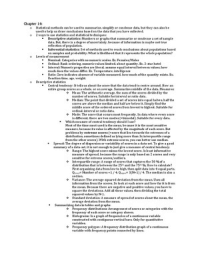
Summary of the whole Statistics book of Stenden University. It contains the chapters 1-5, pages 3-160. It provides all the necessary knowledge of this book. Author received a 8,5 with this summary.

Laatste update van het document: 10 jaar geleden

Voorbeeld 1 van de 6  pagina's

  • Ja
  • 28 oktober 2014
  • 30 oktober 2014
  • 6
  • 2014/2015
  • Samenvatting
book image

Titel boek:

Auteur(s):

  • Uitgave:
  • ISBN:
  • Druk:
Alles voor dit studieboek (5)
Alle documenten voor dit vak (5)

5  beoordelingen

review-writer-avatar

Door: rozanimayenziwe • 6 maanden geleden

review-writer-avatar

Door: stefponne • 7 jaar geleden

review-writer-avatar

Door: aap211 • 7 jaar geleden

review-writer-avatar

Door: naomicalis • 7 jaar geleden

review-writer-avatar

Door: didibbee • 8 jaar geleden

avatar-seller
sasboaz
Chapter 14:
o Statistical methods can be used to summarize, simplify or condense data, but they can also be
used to help us draw conclusions based on the data that you have collected.
o 2 ways to use statistics and statistical techniques:
 Descriptive statistics: Numbers or graphs that summarize or condense a set of sample
data. But, there is a degree of uncertainty, because of information is maybe not true
reflection of population.
 Inferential statistics: Set of methods used to reach conclusions about populations based
on samples and probability. What is likelihood that it represents the whole population?
o Levels of measurement
 Nominal: Categories with no numeric scales. Ex. Females/Males
 Ordinal: Rank ordering, numeric values limited, about quantity. Ex. 2-star hotel
 Interval: Numeric properties are literal, assume equal interval between values, how
much does the values differ. Ex. Temperature, intelligence
 Ratio: Zero indicates absence of variable measured, how much of the quantity exists. Ex.
Reaction time, age, weight.
o Descriptive statistics
 Central tendency: It tells us about the score that the data tend to centre around. How an
entire group scores as a whole, or on average. Summarizes middle of the data. Measures:
 Mean: The arithmetic average, the sum of the scores divided by the
number of scores. Suitable for interval or ratio data.
 Median: The point that divided a set of scores into equal halves, half the
scores are above the median and half are below it. Simply find the
middle score of the ordered scores from lowest to highest. Suitable for
ordinal, interval or ratio data.
 Mode: The score that occurs most frequently. In data where every score
is different, there are two modes (=bimodal). Suitable for every data.
 Which measure of central tendency should I use?
Most of the time most used is the mean, because it is the most sensitive
measure, because its value is affected by the magnitude of each score. But
problems by extreme scores (=score that lies towards the extremes of a
distribution, sometimes defined as lying more than 3x interquartile range
from the other scores). With extreme scores, you can better use median.
 Spread: The degree of dispersion or variability of scores in a data-set. To give a good
summary of a data-set, it is not enough to just give a measure of central tendency.
 Range: The highest score minus the lowest score. Is least informative
measure of spread, because the range is only based on 2 scores and very
sensitive for extreme scores/outliers.
 Interquartile range: A range of scores that captures the 50 % of a
distribution that is between the 25th and the 75th %. How to calculate?
First organizing data from low to high, then split data into 4 equal parts.
Qlower= Number of scores +. Qupper= 3(N+1) / 4. The median is also a
section.
 Variance: The average squared deviation from the mean. Uses all
information from the scores. So look at each score and how far it is from
the mean. Because there are negative and positive values, you have to
square the deviations. Add all these values, then dividing the total
squared values by N-1.
 Standard deviation: A measure of spread of scores about the mean, the
average deviation from the mean.
 Summarizing data in tables and graphs
 Frequency distributions: Arrangement of scores or categories with the
frequency of each score or category shown.
 Histograms: Is a graph of frequencies of a continuous variable
constructed with contiguous vertical bars. Only for quantitative
variables.
 Frequency polygon: A frequency distribution graph of a continuous
variable with frequency points connected by lines.

Voordelen van het kopen van samenvattingen bij Stuvia op een rij:

Verzekerd van kwaliteit door reviews

Verzekerd van kwaliteit door reviews

Stuvia-klanten hebben meer dan 700.000 samenvattingen beoordeeld. Zo weet je zeker dat je de beste documenten koopt!

Snel en makkelijk kopen

Snel en makkelijk kopen

Je betaalt supersnel en eenmalig met iDeal, creditcard of Stuvia-tegoed voor de samenvatting. Zonder lidmaatschap.

Focus op de essentie

Focus op de essentie

Samenvattingen worden geschreven voor en door anderen. Daarom zijn de samenvattingen altijd betrouwbaar en actueel. Zo kom je snel tot de kern!

Veelgestelde vragen

Wat krijg ik als ik dit document koop?

Je krijgt een PDF, die direct beschikbaar is na je aankoop. Het gekochte document is altijd, overal en oneindig toegankelijk via je profiel.

Tevredenheidsgarantie: hoe werkt dat?

Onze tevredenheidsgarantie zorgt ervoor dat je altijd een studiedocument vindt dat goed bij je past. Je vult een formulier in en onze klantenservice regelt de rest.

Van wie koop ik deze samenvatting?

Stuvia is een marktplaats, je koop dit document dus niet van ons, maar van verkoper sasboaz. Stuvia faciliteert de betaling aan de verkoper.

Zit ik meteen vast aan een abonnement?

Nee, je koopt alleen deze samenvatting voor €2,99. Je zit daarna nergens aan vast.

Is Stuvia te vertrouwen?

4,6 sterren op Google & Trustpilot (+1000 reviews)

Afgelopen 30 dagen zijn er 52510 samenvattingen verkocht

Opgericht in 2010, al 14 jaar dé plek om samenvattingen te kopen

Start met verkopen
€2,99  38x  verkocht
  • (5)
In winkelwagen
Toegevoegd