SV Data Analytics
Lecture 1 – Introduction
Knowledge Discovery in Databases (KDD)
➢ The process of (semi-) automatic extraction of knowledge from databases/ process of
discovering useful knowledge from a collection of data, which is
o Valid
o Previously unknown
o Potentially useful
➢ Interdisciplinary field:
o Database systems
▪ Scalability for large datasets – integration from different sources – novel data
types (text)
o Statistics
▪ Probabilistic knowledge – model-based inferences – evaluation of knowledge
o Machine learning
▪ Different paradigms of learning – supervised learning – hypothesis spaces
and search strategies
➢ KDD Process Model
Visual Analytics
➢ Data → visualization → gain insights
➢ Importance of visualization: make both calculations and
graphs. Both sorts of output should be studies; each will
contribute to understanding.
➢ Goals of visualization:
o Presentation
▪ Starting point: facts to be presented are a fixed priority
▪ Process: choice of appropriate presentation techniques
▪ Result: high-quality visualization of the data to present facts
o Confirmatory analysis
▪ Starting point: hypotheses about the data
▪ Process: goal-oriented examination of the hypotheses
▪ Result: visualization of data to confirm or reject the hypotheses
o Exploratory analysis
▪ Starting point: no hypotheses about the data
1
, ▪ Process: interactive, usually
undirected search for structures,
trends
▪ Result: visualization of data to
lead to hypotheses about the data
➢ Visualization: the process of presenting data in a
form that allows rapid understanding of
relationships and findings that are not readily
evident from raw data
➢ 2 ways of going through conceptual pipeline (data
→ visualization OR data → models)
➢ Sense making loop → not a one-way street, but a loop => knowledge generation loop
Lecture 2 – Data Foundations 1
Types of data
➢ Data can be gathered/ generated from many sources. Independent of the source, each data
point has a data type
o Nominal & ordinal => categorial or discrete values
o Numeric => continuous scale
➢ Nominal
o Discrete; not the same values, but no specific ranking →classification without order
(ID, gender)
o No quantitive relationship between categories
➢ Ordinal
o noise comparison; difference in values (one is louder); rank order → attributes can be
rank-ordered
o distance can be arbitrary (smoking habits) → distances between values do not have
any meaning
➢ Numeric
o difference in height; attributes can be rank-ordered
o distances between values have a meaning
o calculations with the data are possible! (height of X = height of Y+5/2); meaningful
distance between values where mathematical operations are possible (age, time)
Typical data classes
➢ Scalar: an individual number in a data record
➢ Multivariate and Mulitdimensional data: multiple variables within a single record can
represent a composite data item; not always easy to calculate difference (bv gender and
weight comparison)
➢ Vector: it is common to treat the vector as a whole; telephone number that can be divided into
country/ region code
➢ Network data: vertices on a surface are connected to their neighbors via edges
➢ Hierarchical data: relationships between nodes in a hierarchy can be specified by links
➢ Time-series data: a complex way of looking into data; time has the widest range of possible
values
o Ducks
o Ordinal: gender
o Numeric: amount
o Vector: location
o Network: parent/child
o Hierarchical: leader/ follower
o Time series: movement
2
,Data preprocessing: Data cleaning
➢ Rubbish in – rubbish out. You have to be certain that you will do data cleaning (treat missing
values) → low-quality data will lead to low-quality mining results
➢ Data cleaning → missing values:
o ignore the tuple (hele rij verwijderen)
▪ + easily done, no computational effort
▪ - loss of information, unnecessary if the attribute is not needed
o fill in the missing value manually
▪ + effective for small datasets
▪ - need to know the value, time consuming, not feasible with large datasets
o use a global constant (-1: don’t use this value for calculations for algorithm)
▪ + can be easily done, perhaps interesting to know the missing value
o use the attribute mean
▪ + simple to implement
▪ - not the most accurate approximation of the value
o use the most probable value
▪ + most accurate approximation of the value
▪ - most computational effort
➢ Data cleaning → noisy data: a random error or variance in a measured variable
o Smooth out the noise!
o Systematic error: sensor always senses a little bit higher – same frequency curve but
shifts to a direction. Average is the same
o Handling noisy data:
▪ Binning: sort data and partition into (equi-depth) bins and then
smooth by bin means, bin median, bin boundaries, etc.
• Equal-width binning:
o Divides the range into N intervals of equal size
o Width of the intervals: width = (max-min)/ N
o Simple
o Outliers may dominate result
• Equal-depth binning:
o Divides the range into N intervals
o Each interval contains approximately the same
number of records
o Skewed data is also handled well
3
, ▪ Regression: smooth out noise by fitting a regression function
o Assume our data can be modelled ‘easily’
o Global linear regression models may not be adequate for
“nonlinear” data
o The regression model can be static or dynamic
▪ Static: using only the historical data to calculate the
function
▪ Dynamic: also use new data to adapt the model
• Linear regression
o Tries to discover the parameters of the straight-line equation
that best fits the data point → line that reduces the squared
error of all data points
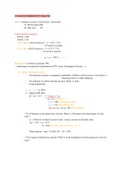
➢ B = 0.6857 is
a very slight slope.
• Non-linear regression (slides)
▪ Clustering: cluster data and remove outliers
(automatically or via human inspection)
Lecture 3 – Data Foundations 2
Best regression line is closest to the points. Almost touching points
sometimes, but the distance is never huge (outlier).
Continuing on Data Preprocessing. Data cleaning discussed, now:
Data Preprocessing: Norminalisation
➢ Linear normalization
➢ Square root normalization (overall wortel van)
➢ Logarithmic normalization (ln() van alles)
➢ Possible solutions for data streams (problem when adding data
to the table, e.g. new min/ max values)
o Rerun the normalization
+ overall correct data representation
- computationally expensive
- perception of previous results distorted
4


