100% tevredenheidsgarantie Direct beschikbaar na betaling Zowel online als in PDF Je zit nergens aan vast
logo-home
Samenvatting An Introduction to Geographical Information Systems, ISBN: 9780273722595 Geographical Information Systems (NBB) €5,49   In winkelwagen

Samenvatting

Samenvatting An Introduction to Geographical Information Systems, ISBN: 9780273722595 Geographical Information Systems (NBB)

1 beoordeling
 45 keer bekeken  3 keer verkocht

Uittreksel van een deel van het boek 'An introduction to Geographical Information systems' van Heywood, Cornelius en Carver, met aanvullingen vanuit het handboek dat uitgereikt is bij het vak Geographical Information Systems aan de Open Universiteit.

Voorbeeld 3 van de 27  pagina's

  • Nee
  • 1 t/m 5, 10
  • 29 december 2021
  • 27
  • 2020/2021
  • Samenvatting
book image

Titel boek:

Auteur(s):

  • Uitgave:
  • ISBN:
  • Druk:
Alle documenten voor dit vak (1)

1  beoordeling

review-writer-avatar

Door: Roebel • 1 jaar geleden

avatar-seller
ellenketting
An introduction to

Geographical Information Systems
Inhoud
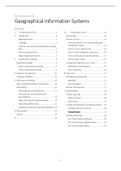
1. Fundamentals of GIS....................................... 2 10. Data quality issues .................................... 14
2. Spatial data ..................................................... 3 Data quality........................................................ 14
Mapping process ............................................. 3 Sources of errors ............................................... 14
Topology .......................................................... 5 Errors arising from our understanding and
Thematic characteristics (attributes) of spatial modelling of reality........................................ 14
data .................................................................. 5 Errors in source data for GIS ......................... 14
Sources of spatial data .................................... 5 Errors in data editing and conversion ........... 15
Digital image classification .............................. 7 Errors in data processing and analysis .......... 15
3. Spatial data modelling ..................................... 9 Errors in data output ..................................... 15
Spatial data models ............................................. 9 Finding and modelling errors in GIS .................. 15
Raster model (location based) ........................ 9 Methods for checking data: .......................... 15
Vector model (entity based)............................ 9 Error modelling .............................................. 16
4. Database management ..................................... 10 B. Data input .......................................................... 17
Creating a database ........................................... 10 B3 Exploring existing data ................................. 17
5. Data input and editing ....................................... 10 Metadata ....................................................... 17
Data encoding (methods of data input) ............ 10 Data catalogues ............................................. 17
Data editing ....................................................... 11 B4 Data characteristics ...................................... 17
Detecting and correcting errors .................... 11 C. Data handling..................................................... 18
Re-projection, transformation and C2 Data querying ............................................... 18
generalization ................................................ 12 Query structure ............................................. 18
Edge matching and rubber sheeting ............. 12 Query types ................................................... 19
Geocoding address data ................................ 12 C3 Data transformation and Reclassification .... 19
Updating and maintaining spatial databases 12
Transformation/conversions ......................... 19
6. Data analysis ...................................................... 13 Reclassification............................................... 21
Queries .............................................................. 13 C4 Data processing ............................................ 22
9. ............................................................................ 13 C4.1 Processing by attributes ........................ 22
C4.2 Processing by neighbourhood............... 22
C4.3 Processing by overlay ............................ 27


1

,1. Fundamentals of GIS
Definition
GIS is the whole infrastructure (computer hardware, software, data, knowledge, procedures, analyses and
people) that can be used to capture, store, check, integrate, manipulate, analyse and display data that are
spatially referenced to earth.  GIS is difficult to define because it comprises many different aspects.

GIS is not just a sophisticated software package
GIS is not only software, but it also involves specific hardware (computer, digitizing table, plotters, etc.) and
procedures (techniques and orders for task implementation). According to some people (e.g. Burrough) it also
includes the organisational context in which a GIS project is being performed.
 You need to formulate a (spatial) question, develop a suitable spatial data model, collect the right data,
perform the right analyses and produce adequate maps. Communicating the results is also important. So, there
is much more to GIS than just pushing the right buttons.

The basic components of a GIS
 Computer system and software  Data management and analysis procedures
 Spatial data  People

The strong points of GIS
 Provides a framework for the efficient collection, storage, analysis and presentation of spatial data
 Can be used to analyse and solve all kinds of societal problems that have a spatial dimension

Examples of questions that could be addressed with GIS when planning new industrial developments
You can locate suitable spots for new industrial developments by mapping the characteristics of the
environment and the planned activities. Examples:
 Transportation routes will be important (to supply and distribute products);
 The environmental impact of different activities can be visualised (e.g. dispersal of noise and pollutants,
and the visualisation of safety zones);
 Vulnerable objects (e.g. schools) can be easily identified and visualised.

Relationship between GIS and geographical information science.
Geographical information science is the science behind geographical information systems (GIS). It involves the
study of the fundamental issues arising from the creation, handling, storage and use of geographic information,
but it also examines the impacts of GIS on individuals and society and the influences of society on GIS.

Spatial data Data which contain a spatial reference (either in relation to each other or to some arbitrary
reference system).
Attribute data Data which specify some kind of characteristics or properties of spatial data.
For example, a dot on a map can represent a “house” and this house can have “five rooms”.
Spatial Specifying the location of an object in relation to a fixed point (which can either be the
referencing origin of a raster or a fixed point on earth or another physical entity).
Spatial entities Objects with a spatial reference that form an entity because of their (common) attributes
(e.g. houses, roads, etc).

What is the difference between a paper map, a digital map and a GIS map?
The main difference is the flexibility. A paper map is much less flexible than a digital or GIS map. A digital or GIS map can be
printed or processed using GIS technology. In this perspective, a digital or GIS map is preferable over a paper map. The
difference between a digital map and a GIS map is the number of layers. A digital map generally consists of one layer,
whereas a GIS map can consist of multiple layers.

After a sand excavation close to the riverbed of the river Rhine, the area needs to be reconstructed in an economically
valuable way. One of the options is to create a recreational area for swimming during summer and ice skating during winter.
First an inventory has to take place whether there are enough potential users of such a recreational area. Which kind of maps
do you need to get this insight?
At least maps with population density and transportation routes, which you can use to make an estimate of how many
people may visit the area in relation to travelling time. You would also need some general data about the amount of
swimmers and skaters in the population.


2

, 2. Spatial data
Information is data with meaning and context added.
Primary data is collected through first-hand observation, while secondary data is collected by another individual
or organization. Dimensions: temporal, thematic and spatial (x, y, z-coordinates).

The map is of fundamental importance in GIS as a :
 Source of data
 Structure for storing data
 Device for analysis and display

Spatial data models
 Descriptive : static description of the relative spatial positions of objects, phenomena and features
 necessary if you want to make a 2D or 3D representation of a person or thing, typically on a
smaller scale. In geography, you typically make a 2D representation of the earth’s surface (or
things located on top or under the earth’s surface) and store it in your computer.
 Predictive : describes the process to predict future situations
 Dynamic : simulate dynamic processes

Mapping process
1. Purpose
Will influence the quality and spatial detail provided by the data set. Knowing the purpose behind a data set
is an essential prerequisite for judging whether or not the data are appropriate for use in a particular
situation. Examples: ski maps, with not all restaurants in Happy Vally; propaganda maps in WWII.
2. Scale
The ratio of a distance on the map to the corresponding distance on the ground:
 Ratio : 1:50 000
 Verbal : 1 cm. represents 50 cm
 Graphical :
3. Features / spacial entities
Abstraction:
 Reduction : Decide which spacial entities to include (discrete vs. continuous)
 Thematic classification : Ordering of entities (objects) into classes that have common characteristics
 Spatial aggregation : Joining of two distinct spatial objects into one spatial entity  the smaller
the scale, the more you will aggregate.
While aggregating, you are actually joining together more than 1 spatial entity into 1 spatial entity. And
while classifying, every spatial entity remains apart, but they are labelled the same if they belong to the
same class. The number of classes and the level of aggregation are a matter of choice and depend on
the scale or level of spatial resolution that is needed.
4. Representation
Choose symbols to represent real world features (points, lines, areas)
5. Generalization
Simplification of details is necessary in order to maintain clarity (scale related):
- Selection
- Simplification
- Displacement
- Smoothing and enhancement

6. Projections
How to treat the world (3D) as a flat surface (2D).
 Knowing the map projection of a map is important for a GIS user because:
 when overlaying maps (data analysis), these maps need to be in the same projection;
 you need to know the map projection in order to translate map coordinates into geographic co-
ordinates.


3

Voordelen van het kopen van samenvattingen bij Stuvia op een rij:

Verzekerd van kwaliteit door reviews

Verzekerd van kwaliteit door reviews

Stuvia-klanten hebben meer dan 700.000 samenvattingen beoordeeld. Zo weet je zeker dat je de beste documenten koopt!

Snel en makkelijk kopen

Snel en makkelijk kopen

Je betaalt supersnel en eenmalig met iDeal, creditcard of Stuvia-tegoed voor de samenvatting. Zonder lidmaatschap.

Focus op de essentie

Focus op de essentie

Samenvattingen worden geschreven voor en door anderen. Daarom zijn de samenvattingen altijd betrouwbaar en actueel. Zo kom je snel tot de kern!

Veelgestelde vragen

Wat krijg ik als ik dit document koop?

Je krijgt een PDF, die direct beschikbaar is na je aankoop. Het gekochte document is altijd, overal en oneindig toegankelijk via je profiel.

Tevredenheidsgarantie: hoe werkt dat?

Onze tevredenheidsgarantie zorgt ervoor dat je altijd een studiedocument vindt dat goed bij je past. Je vult een formulier in en onze klantenservice regelt de rest.

Van wie koop ik deze samenvatting?

Stuvia is een marktplaats, je koop dit document dus niet van ons, maar van verkoper ellenketting. Stuvia faciliteert de betaling aan de verkoper.

Zit ik meteen vast aan een abonnement?

Nee, je koopt alleen deze samenvatting voor €5,49. Je zit daarna nergens aan vast.

Is Stuvia te vertrouwen?

4,6 sterren op Google & Trustpilot (+1000 reviews)

Afgelopen 30 dagen zijn er 75759 samenvattingen verkocht

Opgericht in 2010, al 14 jaar dé plek om samenvattingen te kopen

Start met verkopen
€5,49  3x  verkocht
  • (1)
  Kopen