100% tevredenheidsgarantie Direct beschikbaar na betaling Zowel online als in PDF Je zit nergens aan vast
logo-home
Summary SMCR Study Guide €7,49   In winkelwagen

Samenvatting

Summary SMCR Study Guide

1 beoordeling
 39 keer bekeken  7 keer verkocht

SMCR study guide. Covering all 11 book chapters including notes from class, screenshots from the book and from the formative tests taken in class. Tips and tricks that helped me to understand the course (I have done the course twice now). Including step by step guide on how to do every relevant SPS...

[Meer zien]
Voorbeeld 4 van de 39  pagina's

  • 31 maart 2022
  • 39
  • 2021/2022
  • Samenvatting
Alle documenten voor dit vak (3)

1  beoordeling

review-writer-avatar

Door: dkooyman12 • 1 jaar geleden

avatar-seller
valeriadelavilla
SMCR 2022


What is the sample telling us about the population?
Models are the way to describe and infer about a population using just a sample.

Multivariate means a third variable → moderation, mediation.

Describing a sample:
in a sample /population of (units of analysis) … when one unit of x increases/decreases; a b
coefficient increases/decreases for y

Looking for a distribution in an x population with x samples → sampling distribution.
Distribution of samples. Many samples are put together to form the distribution of
samples.


Chapter 1: Sampling distribution.

Draw a sample of the population and try to generalise the sample to the population.
Crucial link between the pop and the sample drawn at random from the population.

Sample and population → the distribution of (units of analysis) in the population and
distribution of (units of analysis) in the ONE sample, is going to be different.

*the distribution of (colours say) in the sample is not representative of the distribution of
colours in the population → a single random sample may give the wrong image of the
population.

*THIS is why we need a sampling distribution of the samples, to generalise about the
population.

A sampling distribution contains very many samples, the units of analysis in the sampling
distribution are the samples not the COLOURS in the previously mentioned single sample.


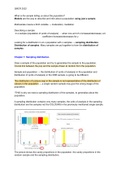
The picture shows the candy proportions in the population, the candy proportions in the
random sample and the sampling distribution.

,SMCR 2022


“Number of yellow candies” in the sampling distribution constitutes the sampling space.

Y-axis in the sampling distribution are the count of yellow candies in the sample and the
proportion or probability up to 100%.

This sampling distribution shows us the prob of drawing a sample with a particular number of
units of analysis from a population in which the colours are equally distributed.

As there are 5 colours, there is a 20% chance of drawing yellow candies in a sample, which
means that in the population, as it is representative from the sample, the expected value will
be 2 yellow candies per bag. Meaning, that 2 is the expected value.

*We assume that the sample is representative of the population.

The expected value is the mean of the sampling distribution.
The mean of the sampling distribution is the true population value.

→ The expected value is the true population value.

STEPS to take:

1. draw thousands of samples to get the sampling distribution
2. take the mean of the sampling distribution
3. now we know the true population value

BUT

1. the sample must be random for this to happen
2. the sample statistic must be an unbiased estimator of the population
3. continuous vs discrete sample statistics; population densities, population probabilities.
4. very impractical, thousands of samples, a lot of time, resources and efforts.

So we need other ways to calculate sampling distributions

A sampling distribution is a probability distribution → a probability distribution involves a
percentage (this is usually seen in the Y axis of the distribution and labelled as so.)

,SMCR 2022


Figure 1: Sampling distribution showing probability in the Y axis.

In this case, the samples of the number of heads coming up are the units of analysis
and the times/frequency of those happening are the sample statistic or sample result.

Sample result/Sample statistic → random variable, this number is dependent on chance, the
result is always random.

The average value of the sampling distribution means that in the population we have the
same value as a hypothesised value (H0)

hypothesised value (H0) = parameter (the value generalised to the given population.


Notes from class, Tutorial 1


Question Formative test.
- For a discrete variable we always use probabilities because every discrete outcome
has a probability.
- A probability distribution not always

, SMCR 2022


Chapter 2: Probability Models

How to develop probability distributions without having to spend all time taking samples, and
spending all that money.

There are other ways to create a sampling distribution other than taking sample by sample.

Bootstrapping, Exact approach, Theoretical approximations

Bootstrap samples → samples after the first initial sample, all drawn in the second step.
We always collect the sample statistic of interest and then add it to the sampling distributions
→ the sample statistic of interest are the samples.

The samples are usually 5,000 to obtain the sampling distribution.

A bootstrap sample (second sample) always has to be the same as the initial sample.
*We must always draw samples with the same count as the initial sample.
Sampling with replacement.

Representing the sampling distribution
When the probabilities of the sampling distribution CAN be calculated; this is a binomial
distribution.

Compare both proportions, the one in the bootstrap sample and the one in the sampling
distribution.

Any sample statistic can be bootstrapped.
SPSS reports the Bootstrap as a confidence interval.

Exact approaches to a sampling distribution.
If we know, or think we know the proportion of the sample statistic in a population, then we
can exactly calculate the probability that a sample of that sample statistic contains the true
population value.

We draw combinations given the sample statistic and these combinations are calculated by
fractions.

It is important! Because the bootstrap samples are more likely to resemble the initial sample.

Exact approaches for categorical data

→ Using frequencies.

Why does a sampling distribution have a bell shape?
By assuming very low or very high values are rare, the sampling distribution tends to peak
around the middle / average values.
The results are symmetrical- same probability of drawing very low or very high values.

Voordelen van het kopen van samenvattingen bij Stuvia op een rij:

Verzekerd van kwaliteit door reviews

Verzekerd van kwaliteit door reviews

Stuvia-klanten hebben meer dan 700.000 samenvattingen beoordeeld. Zo weet je zeker dat je de beste documenten koopt!

Snel en makkelijk kopen

Snel en makkelijk kopen

Je betaalt supersnel en eenmalig met iDeal, creditcard of Stuvia-tegoed voor de samenvatting. Zonder lidmaatschap.

Focus op de essentie

Focus op de essentie

Samenvattingen worden geschreven voor en door anderen. Daarom zijn de samenvattingen altijd betrouwbaar en actueel. Zo kom je snel tot de kern!

Veelgestelde vragen

Wat krijg ik als ik dit document koop?

Je krijgt een PDF, die direct beschikbaar is na je aankoop. Het gekochte document is altijd, overal en oneindig toegankelijk via je profiel.

Tevredenheidsgarantie: hoe werkt dat?

Onze tevredenheidsgarantie zorgt ervoor dat je altijd een studiedocument vindt dat goed bij je past. Je vult een formulier in en onze klantenservice regelt de rest.

Van wie koop ik deze samenvatting?

Stuvia is een marktplaats, je koop dit document dus niet van ons, maar van verkoper valeriadelavilla. Stuvia faciliteert de betaling aan de verkoper.

Zit ik meteen vast aan een abonnement?

Nee, je koopt alleen deze samenvatting voor €7,49. Je zit daarna nergens aan vast.

Is Stuvia te vertrouwen?

4,6 sterren op Google & Trustpilot (+1000 reviews)

Afgelopen 30 dagen zijn er 75323 samenvattingen verkocht

Opgericht in 2010, al 14 jaar dé plek om samenvattingen te kopen

Start met verkopen
€7,49  7x  verkocht
  • (1)
  Kopen