100% tevredenheidsgarantie Direct beschikbaar na betaling Zowel online als in PDF Je zit nergens aan vast
logo-home
SPSS korte aantekeningen €3,08
In winkelwagen

Overig

SPSS korte aantekeningen

 34 keer bekeken  3 keer verkocht

Dit document bestaat uit de verschillende testen die worden behandeld bij het vak Statistics and Metholodogy. Er staat stap voor stap welke knoppen je moet gebruiken per test en wat de interpretatie is van de testen die je moet gebruiken. Dit document gebruikte ik als een geheugensteuntje voor alle...

[Meer zien]
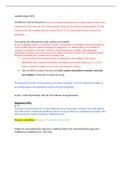
Voorbeeld 2 van de 5  pagina's

  • 13 april 2022
  • 5
  • 2021/2022
  • Overig
  • Onbekend
Alle documenten voor dit vak (2)
avatar-seller
sudeakturan
Aantekeningen SPSs

Confidence interval outcome= If we were to repeat this experiment a large number of times, and
compute the CI for each one, 95% of them would contain the true mean of the population. For this
reason we are 95% confident that our interval [26.59; 27.22] may contain the true mean of the
population.


Corretation test dichotomous and continuous variables:
i), since vegetable intake is a continuous variable, and greentea consumption (although actually an
count variable, but has a sufficient number of categories). For situation ii) it is not sensible to
compute a correlation coefficient, as they are both dichotomous variables. The appropriate
alternative would be to do a chi-square test or fishers’s exact-test on the 2 by 2 contingency table.
Another alternative here, could be the 2-sample z-test.
 A 2 by 2 table can be analyzed using a Chi-square test, which follows a Chi-square
distribution with 1 degree of freedom as the degrees of freedom is given by: (r-1)*(c-1),
where r stands for number of rows, and c for number of columns.
 Now use SPSS to conduct the same test (hint: analyze>descriptives>crosstabs, and check
out ‘statistics’). Remember to paste the syntax.


The adjusted R2 is 0.071, meaning that we can expect to explain 7.1% of the individual variation in
processing speed in the population based on fish oil consumption


Graphs: ‘Most importantly; they do not indicate strong skewness.’


Regression WG2:
β=0
The slope is not constant (≠0), so there appears to be an association. However, we’d still need to
test if this slope is statistically significant, before we can say there is a significant association). The
intercept is 2.55, and the regression coefficient is 0.02.

Pearson correlation: [Analyze  Correlate  Bivariate]


Divide the unstandardized regression coefficient (B) by the unstandardized regression
coefficient’s standard error= de T-test

, In the Shapiro-Wilk test, the null hypothesis H0 is that the data are normally distributed,
while the alternative hypothesis Ha is that they are not normally distributed. If you run
such a test and find P-value < 0.05, does this mean your data violate the assumption?

Yes, it means that the conclusion of the test is to reject the H 0 that the residuals are normally
distributed.:
Shapiro wilk test significant look better at data non parametric?


The H0 of both the Kolmogorov-Smirnov and the Shapiro-Wilk is: the data are normally
distributed, with Ha being: the data are not normally distributed.
As all p-values, of both the Kolmorgorov-Smirnov and the Shapiro-Wilks test, are > .05,
H0 is not rejected and the data distributions in all groups can thus be considered normal.
Again: Officially one can never state this. Yet it is often done so, and it is justifiable. The
statement ”We consider the data normal” means in fact, “We consider the data not non-
normal, so let’s continue!”.

ANOVA WG 3:

Simple: Each group is compared to the first (or last)
1 vs 2, 1 vs 3, 1 vs 4

Repeated: each group is compared to the next group
1 vs 2, 2 vs 3, 3 vs 4

Helmert: each group is compared to the mean of all subsequent groups
1 vs 2+3+4, 2 vs 3+4, 3 vs 4


Levene test:
 H0 of the Levene test is “all variances are equal”, Ha is “not all variances are equal”.
 p value higher than 0.05 NS equal variance 
o The test is not significant: F(3,86)=1.11, ns, so we conclude that the variances
can be considered equal.
 Significant?  Welch test/ brown test


Welch F(3,45.00)=1.11, ns
Brown-Forsythe F(3,69.19)=.66, ns
These tests indicate that the groups did not differ with respect to mean IQ.
the differences in IQ were not statistically significant, i.e., we were not able to establish a
difference in IQ between the 4 groups

Voordelen van het kopen van samenvattingen bij Stuvia op een rij:

Verzekerd van kwaliteit door reviews

Verzekerd van kwaliteit door reviews

Stuvia-klanten hebben meer dan 700.000 samenvattingen beoordeeld. Zo weet je zeker dat je de beste documenten koopt!

Snel en makkelijk kopen

Snel en makkelijk kopen

Je betaalt supersnel en eenmalig met iDeal, creditcard of Stuvia-tegoed voor de samenvatting. Zonder lidmaatschap.

Focus op de essentie

Focus op de essentie

Samenvattingen worden geschreven voor en door anderen. Daarom zijn de samenvattingen altijd betrouwbaar en actueel. Zo kom je snel tot de kern!

Veelgestelde vragen

Wat krijg ik als ik dit document koop?

Je krijgt een PDF, die direct beschikbaar is na je aankoop. Het gekochte document is altijd, overal en oneindig toegankelijk via je profiel.

Tevredenheidsgarantie: hoe werkt dat?

Onze tevredenheidsgarantie zorgt ervoor dat je altijd een studiedocument vindt dat goed bij je past. Je vult een formulier in en onze klantenservice regelt de rest.

Van wie koop ik deze samenvatting?

Stuvia is een marktplaats, je koop dit document dus niet van ons, maar van verkoper sudeakturan. Stuvia faciliteert de betaling aan de verkoper.

Zit ik meteen vast aan een abonnement?

Nee, je koopt alleen deze samenvatting voor €3,08. Je zit daarna nergens aan vast.

Is Stuvia te vertrouwen?

4,6 sterren op Google & Trustpilot (+1000 reviews)

Afgelopen 30 dagen zijn er 53068 samenvattingen verkocht

Opgericht in 2010, al 14 jaar dé plek om samenvattingen te kopen

Start met verkopen
€3,08  3x  verkocht
  • (0)
In winkelwagen
Toegevoegd