Lecture 1: is there a problem?
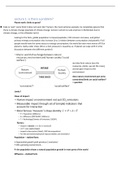
Planet earth: limits to grow?
➔ Fake or real?: some think it does not exist. But Trump is the most extreme example, he completely ignores that
there is climate change (example of climate change: lecturer cannot ice sate anymore in Rotterdam due to
climate change, or the elfsteden tocht)
looking to the facts, global population increases/explodes, CO2 emission increases, and global
primary energy consumption also increase (1 to 1 relation between consumption and growth). If all
people would have the same excess to energy consumption, the world be even more worse off! Our
planet is really under stress (this is a fact, pressure is issued by us. If planet can cope with it is the
discussion between the different parties!)
we take form nature (use the
resources, plants, we eat the cows),
and we give it back to the
environment
does nature environment put some
constraints/limits on social welfare?
= question
Limits?
Flows of impact:
Population – stylized facts
• Exponential growth path previous 2 centuries!
• Still a growing overall stock...
P: the population shows a natural population growth in most parts of the world
Affluence – stylized facts
,GDP per capita has grown a lot from 1870 to 2016
A – China
SEE LECTURE
Technology – stylized facts
• Impact also depends on ‘quality’ of human activity
T (see lecture)
IPAT (see lecture)
From impact to concern?
• Clearly human impact on globe has exploded in a very short period of time!
• To what extent does Impact pose a concern?
- Only if Impact = ‘pollution’ = negative impact on welfare today or tomorrow
• Impact along many dimensions
- 118 chemical elements including lead (Pb) and mercury (Hg)
- US EPA has more than 85,000 chemicals listed on its inventory of substances that fall under the
Toxic Substances Control Act (TSCA).
- 1,500 new chemicals each year
• Flow versus Stock related pollutants (‘accumulation’)
- Climate change vs. Air pollution
Air pollution:
Air pollution (smog) in London in 1950s ... https://www.history.com/news/the-killer-fog-that-
blanketed-london-60-years-ago
• Chemical elements involved: CO; SO2; NOx, NH3 , PM2,5, etc
• Polluting activities: Electricity production, industry, traffic, agriculture, forest fires
• Confusing: Impact in I(PAT) = Emission ≠ Pollution
Air pollution:
• Welfare impact:
1. Physical impact through quality lung capacity and blood circulation
2. Impact measured through higher probability of early
3. Pollution causes premature deaths
Impact pathway assessment is a bottom-up-approach in which environmental benefits and costs are
estimated by following the pathway from source emissions via quality changes of air, soil and water
to physical impacts, before being expressed in monetary benefits and costs.
More concerns?:
• Impact = Many dimensional (often interrelated) vector of exchange
• energy inputs (see before)
• material inputs
• waste output
• pollution
,• land use
• biodiversity
Materials (see lecture):
• Three big waves in EU and US:
- first wave (1800-1950) depends on
steel, cement and paper (steel industry,
rail infrastructure, construction);
- second wave (1950-2000) depends on
chemicals like chlorine, ethyleen,
amonia (chemical industry) and
aluminium
• third wave (2000 onwards) depends
on bio-manipulation (genetic
modification)?
• Note: waves are often complements
not substitutes!
Waste (see lecture):
Pollution:
• Lead
• Mercury
• Mining
• Plastics
• Fertilizers
• Pesticides (Glyfosaat; other neoniticides; etc)
• Chemicals (PCB’s; PFAS; etc)
• Medicine (including drugs)
• etc
Land use (see lecture):
Biodiversity(see lecture):
More concerns?:
• Exchange dependent on type of growth generating sectors!
• Almost no wave disappears
• Many, many concerns
• often stock related
• unknown thresholds
• Flow versus Stock related pollutants (‘accumulation’)
• Data = facts = essential information (https://ourworldindata.org/)
Hope? (see lecture):
, Hopeful signs, but so much remains to do
Environmental Kutnets curve?:
• This idea of inverted-U between long run GDP and ‘pollution’
is called Environmental Kuznets Curve (EKC)
- Demand for environmental quality is a luxury good (see Box
2.2)!
- Growth of sectors (IT; internet) and technological change
would (strongly) improve environmental productivity per unit
of output
• Hypothesis: inverted U impact first rises with income, but
declines after some threshold
Environmental kutnets curve?
And some other reasons for hope (see lecture):