Summary Syllabus BBS1003
Chapter 1
1.1 Types of variables
Two variables:
- Qualitative variables (categorical/discrete): nominal, ordinal
- Quantitative variables (continuous): interval, ratio
Nominal: the score are only intended to distinguish between the different
categories. Like 0=female and 1=male. The scores don’t have any
meaning.
vb. Hair colour
- No order
- The space between the scores does not have any meaning
Ordinal: the categories are ordered.
vb. Social economic class (low, middle, high)
Interval: the distance between the scores have a meaning
vb. Temp in °C, IQ level
Ratio: there is an absolute zero point.
vb. Weight, age
1.2 Summarizing data
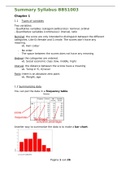
You can put the data in a frequency table.
Another way to summarize the data is to make a bar chart.
Pagina 1 van 26
,Summary Syllabus BBS1003
A bar chart has a blank space between the bars.
The bars are not connected to each other and the distance between the
bars does not have any meaning either.
A bar chart is often used to summarize the outcome of a qualitative
variable.
In a histogram there is no space between the bars and we use it to
summarize quantitative variables.
Each bar has a surface that is exactly equal to the frequency of the score
represented by that bar.
To create a histogram, we use grouping.
11.3 5.1 12.1 7.8 15.9 8.2 10.7 6.8 10.7 12.9
11.7 12.6 8.1 9.4 12.9 8.2 3.8 11.4 10.3 6.1
n = 20
smallest score = 3.8
largest score = 15.9
A possible width is 3, so you create 5 classes.
[3.5, 6.5>, [6.5, 9.5>, … [15.5, 18.5>
Pagina 2 van 26
, Summary Syllabus BBS1003
1.3 Theoretic distribution, measures of tendency and Pearson correlation
When the number of classes becomes very large, then we will create a
theoretic distribution.
Negative: left skewed
Positive: right skewed
The mean is very sensitive for extreme values. When the distribution
is skewed to the right, it means that there are (extreme) large values.
Variance = a measure of how peeked/flat the distribution is. It represents
much the subjects differ from each other regarding to their scores.
The variance and the standard deviation represent the same
information.
But the SD is more used because it is expressed in the same scale as
the values.
vb. if X represents length in inches, then the average value and the SD are
also expressed in inches. The variance is expressed as ‘square of inches’,
which is more difficult to interpret in practice.
Pagina 3 van 26
Voordelen van het kopen van samenvattingen bij Stuvia op een rij:
Verzekerd van kwaliteit door reviews
Stuvia-klanten hebben meer dan 700.000 samenvattingen beoordeeld. Zo weet je zeker dat je de beste documenten koopt!
Snel en makkelijk kopen
Je betaalt supersnel en eenmalig met iDeal, creditcard of Stuvia-tegoed voor de samenvatting. Zonder lidmaatschap.
Focus op de essentie
Samenvattingen worden geschreven voor en door anderen. Daarom zijn de samenvattingen altijd betrouwbaar en actueel. Zo kom je snel tot de kern!
Veelgestelde vragen
Wat krijg ik als ik dit document koop?
Je krijgt een PDF, die direct beschikbaar is na je aankoop. Het gekochte document is altijd, overal en oneindig toegankelijk via je profiel.
Tevredenheidsgarantie: hoe werkt dat?
Onze tevredenheidsgarantie zorgt ervoor dat je altijd een studiedocument vindt dat goed bij je past. Je vult een formulier in en onze klantenservice regelt de rest.
Van wie koop ik deze samenvatting?
Stuvia is een marktplaats, je koop dit document dus niet van ons, maar van verkoper edmeesnijders. Stuvia faciliteert de betaling aan de verkoper.
Zit ik meteen vast aan een abonnement?
Nee, je koopt alleen deze samenvatting voor €5,79. Je zit daarna nergens aan vast.