Lecture 1.
Motivating example
Suppose I tell you that the mean lap time for setup a is 118 seconds and the mean lap time
for setup b is 110 seconds.
Can you confidently recommend setup b? answer: setup b is faster.
What caveats (red flags) might you consider? Answer: weather conditions.
Suppose I tell you that the SD for the times under setup a is 7 seconds and the SD for the
times under setup b is 5 seconds.
How would you incorporate this new information into your decision?
Suppose, instead, that the SD of times under setup a is 35 seconds and the SD under setup b
is 25 seconds.
How should you adjust your appraisal of the setups’ relative benefits?
Answer: We are more confident about setup B under the first scenario. SD of 5 second
might seem to be more precise measure than 25 seconds of SD. (how well we measured the
lap times)
Before making any decision, we have to consider variability
Statistical reasoning
The preceding example calls for statistical reasoning (when we think about uncertainty in
our measurement).
The foundation of all good statistical analyses is a deliberate, careful and through
consideration of uncertainty.
In the previous example, the mean lap time for Setup A is clearly longer than the
mean lap time for Setup B.
If the times are highly variable, with respect to the size of the mean difference, we
may not care much about the mean difference (not much difference between 2
variables).
The purpose of statistics is to systematize the way that we account for uncertainty
when making data-based decisions.
Statistics for Data Science
Data scientists must scrutinize(examine) large numbers of data and extract useful
knowledge
Data contain raw information.
To convert this information into actionable knowledge, data scientists apply various
data analytic techniques.
When presenting the results of such analyses, data scientists must be careful not to
over-state their finding.
Too much confidence in an uncertain finding could lead your employer to waste
large amounts of resources chasing data anomalies (irregular).
Statistic offers us a way to protect ourselves from ourselves.
,Probability Distributions
Before going any further we’ll review the general concept of a probability distribution.
Probability distributions quantify how likely it is to observe each possible value of
some probabilistic entity. / represents the expected outcomes of possible values for a
given data generating process
Probability distributions are re-scaled frequency distributions.
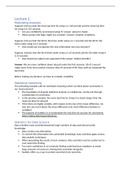
We can build up the intuition of a probability density by beginning with a histogram.
With an infinite number of bins, a
histogram smooths into a
continuous curve.
In a loose sense, each point on
the curve gives the probability
of observing the corresponding
X value in any given sample.
The area under the curve must
integrate to 1.0.
Reasoning with Distribution
We will gain insight by conceptualizing our example problem in terms of the underlying
distributions of lap times.
Instance 1 states that there are two distributions, but in instance 2 they are overlapping, so
you can’t say that they come from two different distributions.
Statistical Testing
In practice, we may want to distill (extract the essential meaning) the information in the
preceding plots into a simple statistic so we can make a judgment.
One way to distill this information and control for uncertainty when generating
knowledge is through statistical testing.
o When we conduct statistical tests, we weight the estimated effect by the
precision of the estimate.
A common type of statistical test, the Wald Test, follows this pattern:
T = Estimate - Null Hypothesized Value / Variability (how well we estimated)
, If we want to test the null hypothesis of a zero-mean difference, applying Wald test
logic to control for the uncertainty in our estimate results in the familiar t-test:
Applying the preceding formula to the first instantiation of our example problem produces:
If we consider the second instantiation of our example problem, the effect does not change,
but our measure of variability does:
As a results, our test statistic changes to reflect our decreased certainty:
(the larger the t test-statistic the better)
In R:
Voordelen van het kopen van samenvattingen bij Stuvia op een rij:
Verzekerd van kwaliteit door reviews
Stuvia-klanten hebben meer dan 700.000 samenvattingen beoordeeld. Zo weet je zeker dat je de beste documenten koopt!
Snel en makkelijk kopen
Je betaalt supersnel en eenmalig met iDeal, creditcard of Stuvia-tegoed voor de samenvatting. Zonder lidmaatschap.
Focus op de essentie
Samenvattingen worden geschreven voor en door anderen. Daarom zijn de samenvattingen altijd betrouwbaar en actueel. Zo kom je snel tot de kern!
Veelgestelde vragen
Wat krijg ik als ik dit document koop?
Je krijgt een PDF, die direct beschikbaar is na je aankoop. Het gekochte document is altijd, overal en oneindig toegankelijk via je profiel.
Tevredenheidsgarantie: hoe werkt dat?
Onze tevredenheidsgarantie zorgt ervoor dat je altijd een studiedocument vindt dat goed bij je past. Je vult een formulier in en onze klantenservice regelt de rest.
Van wie koop ik deze samenvatting?
Stuvia is een marktplaats, je koop dit document dus niet van ons, maar van verkoper adata. Stuvia faciliteert de betaling aan de verkoper.
Zit ik meteen vast aan een abonnement?
Nee, je koopt alleen deze samenvatting voor €6,49. Je zit daarna nergens aan vast.