Chapter 1; An overview of regression analysis
Econometrics (economic measurement); the quantitative measurement and analysis of actual economic and
business phenomena. In econometrics, we look at relationships between variables using mathematical functions.
Econometrics has three major uses;
- Describing economic reality
o Quantifying economic activity and measuring marginal effects
Q = β0 + β1P + β2Ps + β1Yd
- Testing hypotheses about economic theory and policy
o Hypotheses testing is the evaluation of alternative theories with quantitative evidence.
- Forecasting future economic activity based on what has happened in the past
o The accuracy of forecasts depends on the degree to which the past is a good guide to the future.
Multivariate thinking is the realisation that in economic reality, many factors play a role, of which some are more
important than others. Regression analysis is an instrument developed for studying this complex social reality. It
allows you to look underneath the surface of things and find out which factors are really important and which not.
Regression analysis; a statistical technique that attempts to ‘explain’ movements in one variable (dependent
variable) as a function of movements in a set of other variables (independent (explanatory) variables), through the
quantification of one or more equations.
- Q = β0 + β1P + β2Ps + β1Yd
o Dependent variable is the quantity demanded (Q)
o Independent variables are product price (P), substitutes’ product price (P s)
& disposable income (Yd)
o β = estimated regression coefficient
Single-equation linear regression model; Y = β0 + β1X
- Y = the dependent variable & X = the independent variable
- β0 = constant term (or intercept term); it indicates the value of Y when X is zero
- β1 = slope coefficient; the amount that Y will change when X increases by one unit.
! An equation is linear if plotting the function in terms of X and Y generates a straight line.
A stochastic error term (ɛ) is a term that is added to a regression equation to introduce all of the variation in Y that
cannot be explained by the included independent variables Xs.
- Y = β0 + β1X + ɛ = E(Y|X) + ɛ
o β0 + β1X is the deterministic component = expected value of Y given X; E(Y|X) = β0 + β1X
o ɛ is the stochastic component
Sources of variation in Y other than the variation in the included Xs;
- Many minor influences are omitted (weggelaten) from the equation
- It is virtually impossible to avoid some sort of measurement error in the dependent variable
- The underlying theoretical equation might have a different functional form (or shape) than the one chosen
for the regression.
- Human behaviour is (partly) unpredictable (purely random variation).
The single-equation linear regression model can be extended;
- To include reference to the number of observations;
o Yi = β0 + β1Xi + ɛi (i = 1,2,3,….N)
Yi = the ith observation of the dependent variable
Xi = the ith observation of the independent variable
ɛi = the ith observation of the stochastic error term
N = the number of observations
- To allow the possibility of more than one independent variable multivariate linear regression model
o Yi = β0 + β1X1i + β2X2i + β3X3i + ɛi
X1i = the ith observation of the first independent variable
X2i = the ith observation of the second indepent variable
X3i = the ith observation of the third independent variable
! the meaning of the regression coefficient β1 is the impact of one-unit increase of X1, holding constant X2 and X3
, o Yi = β0 + β1X1i + β2X2i + ….+ βKXKi + ɛi (K = independent variables, i = number of observations)
The ability of regression analysis to measure the impact of one variable on the dependent variable, holding constant
the influence of other variables in the equation, is a tremendous (enorm) advantage.
- While regression analysis specifies that a dependent variable is a function of one or more independent
variables, regression analysis alone cannot prove or even imply causality!
Estimated regression equation; the quantified version of the theoretical regression equation (contains numbers)
- Theoretical equation; Yi = β0 + β1Xi + ɛi
- Estimated regression equation; Y ^ i = ^β 0 + ^β 1Xi
o Y ^ = estimated value of Y ór fitted value of Y
o ^β = estimated regression coefficients; the empirical best guesses of the true regression coefficients
o Y ^ i = 103.40 + 6.38Xi
^
! the closer the Y are to the Ys in the sample, the better the fit (lower residual) of the equation.
o Residual (ei) = Yi - Y^i
Error term (ɛi) = Yi – E(Yi|Xi)
- It is the difference between the observed Y and the true
regression equation (the expected value of Y).
- The residual can be thought of as an estimate of the error
term, so e = ɛ^
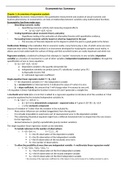
The true relationship between X and Y (solid line) cannot
be observed, but the estimated regression line (dashed
line) can.
The difference between an observed data point (for
example, i = 6) and the true line is the value of the
stochastic error term (ɛ6).
The difference between the observed Y6 and the
^ 6) is the value
estimated value from the regression line (Y
of the residual for this observation (e6)
How do we obtain data if we cannot perform controlled experiments in economics?
- Nonexperimental data
o Time series; data collected from discrete intervals during time
o Cross section; data ccollecte on a moment in time from different economic entities.
o Panel data; combination of both.
Type Properties Examples of data usage
Cross-section One moment in time Population density across areas to explain the
number of restaurants
Multiple economic entities: individuals, districts,
countries, patients, households, schools Height of individuals to estimate their weight
Time-series Over time Your height over the years to estimate your
own weight
Single (or a few) economic entities
Food price fluctuations to study consumption
behaviour
Panel Two or more moments in time Households’ graduation out of poverty over
time in response to microfinance offers
Multiple economic entities
Political competition over the years to explain
The same economic entities over time regional infrastructure development
, Chapter 2; Ordinary Least Squares
The purpose of regression analysis is to take a theoretical equation (Y i = β0 + β1Xi + ɛi) and use a set of data to create
an estimated equation (Y ^ i = ^β 0 + ^β 1Xi). The purpose of the estimation technique is to obtain numerical values for the
coefficients. This can be done by using the Ordinary Least Squares (OLS).
Ordinary Least Squares (OLS); a regression estimation technique that calculates the ^β s so as to minimize the sum of
the squared residuals.
N
OLS minimizes ∑ ei
2
- (i = 1, 2, …., N)
i=1
^ I = actual Y – estimated Y
o e = Yi - Y
- OLS minimizes ∑ ¿¿
We use OLS to estimate regression models, because;
- OLS is relatively easy to use
N
The goal of minimizing ∑ ei is quite appropriate from a theoretical point of view
2
-
i=1
- OLS estimates have at least two useful properties;
o The sum of the residuals is exactly zero
o OLS can be shown to be the ‘best’ estimator possible under a set of specific assumptions.
Estimator; a mathematical technique that is applied to a sample of data to produce a real-
world numerical estimate of the true population regression coefficient.
! thus, OLS is an estimator & ^β produced by OLS are estimates.
Estimating a single-independent-variable regression model (Yi = β0 + β1Xi + ɛi)
N
∑ [( X i−X )(Y i−Y )]
- ^β 1= i=1
N
∑ ¿¿¿
i=1
- ^β =Y − ^β X
0 1
o x = the mean (gemiddelde) of X (¿ ∑ X i /N ¿ ¿
o Y = the mean (gemiddelde) of Y (¿ ∑ Y i / N ¿ ¿
Estimating a multivariate regression model (Yi = β0 + β1X1i + β2X2i + ….+
βKXKi + ɛi)
- The slope coefficients are called partial regression coefficients,
that allow a researcher to distinguish the
impact of one variable from that of another independent
variable.
- The multivariate regression coefficient indicates the change in
the dependent variable associated with a one-
unit increase in the independent variable in question, holding
constant the other independent variables.
- OLS estimation of multivariate models is identical in general approach to the OLS estimation of models with
just one independent variable.
! Since the size of a coefficient clearly depends on the units of measurement of the variable, we cannot use
coefficient size alone to make judgements about the importance of a variable.
Total Sum of Squares (TSS); amount of variation explained by the squared variations of Y around its mean
N
- TSS = ∑ ¿¿
i=1
- Decomposition of variance;
o ∑ ¿¿
i
Voordelen van het kopen van samenvattingen bij Stuvia op een rij:
Verzekerd van kwaliteit door reviews
Stuvia-klanten hebben meer dan 700.000 samenvattingen beoordeeld. Zo weet je zeker dat je de beste documenten koopt!
Snel en makkelijk kopen
Je betaalt supersnel en eenmalig met iDeal, creditcard of Stuvia-tegoed voor de samenvatting. Zonder lidmaatschap.
Focus op de essentie
Samenvattingen worden geschreven voor en door anderen. Daarom zijn de samenvattingen altijd betrouwbaar en actueel. Zo kom je snel tot de kern!
Veelgestelde vragen
Wat krijg ik als ik dit document koop?
Je krijgt een PDF, die direct beschikbaar is na je aankoop. Het gekochte document is altijd, overal en oneindig toegankelijk via je profiel.
Tevredenheidsgarantie: hoe werkt dat?
Onze tevredenheidsgarantie zorgt ervoor dat je altijd een studiedocument vindt dat goed bij je past. Je vult een formulier in en onze klantenservice regelt de rest.
Van wie koop ik deze samenvatting?
Stuvia is een marktplaats, je koop dit document dus niet van ons, maar van verkoper T00. Stuvia faciliteert de betaling aan de verkoper.
Zit ik meteen vast aan een abonnement?
Nee, je koopt alleen deze samenvatting voor €6,99. Je zit daarna nergens aan vast.