100% tevredenheidsgarantie Direct beschikbaar na betaling Zowel online als in PDF Je zit nergens aan vast
logo-home
Samenvatting MAW-NL: Inleiding statistiek (SPSS) 2022 {PASS} €3,55
In winkelwagen

Samenvatting

Samenvatting MAW-NL: Inleiding statistiek (SPSS) 2022 {PASS}

 1 keer verkocht

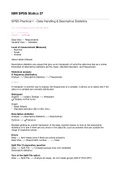
Deze handleiding kun je gebruiken tijdens de digitale SPSS toets van MTO-B-MAW: inleiding statistiek. Hierin worden de stappen uitgelegd die je moet volgen om de opdrachten uit te voeren. Succes!

Voorbeeld 2 van de 6  pagina's

  • 28 september 2022
  • 6
  • 2021/2022
  • Samenvatting
Alle documenten voor dit vak (2)
avatar-seller
rubiluneta
IBM SPSS Statics 27

SPSS Practical 1 - Data Handling & Descriptive Statistics

Tip: Percentages typ je met een punt.

Rij — horizontaal
Kolom — verticaal

Data View — Respondents
Variable View — Variables

Level of measurement (Measure)
- Nominal
- Scale
- Ordinal
Value Labels (Values)

Descriptive statistics are values that give us an impression of what the data look like as a whole.
Examples of descriptive statistics are the mean, standard deviation, and frequencies.

Statistical analysis
A frequency distribution
Analyze —> Descriptive Statistics —> Frequencies

Output

A histogram is another way to display the frequencies of a variable. It allows us to easily see if the
data on a variable are normally distributed.

Histogram
Graphs —> Legacy Dialogs —> Histogram
✔ Display normal curve

Graph
- Mean (Mean)
- Standard deviation (SD or Std. Dev.)
Descriptive statistics
Analyze —> Descriptive Statistics —> Descriptives
Options —> ✔ Variance

Besides getting an overall impression of the data, another reason to look at the descriptive
statistics is to see if there are any errors in the data le, such as answers that are outside the
range of expected values.

Errors
Data —> Sort Cases (only if there are empty answers)
Data View —> Respondent number … —> Clear

Split File/ Comparative question
Data —> Split File —> Compare groups (only one variabele)
Descriptive statistics*

Turn of the Split File option
Data —> Split File —> Analyze all cases, do not create groups (SPLIT FILE OFF.)


fi

, Missing values can occur for all kind of reasons. Respondents may refuse to give answers, did not
understand the question and therefore refrain from answering the question, or simply overlook a
question.

Missing values
A frequency distribution*
Missing System

Data —> Sort Cases
Data View —> Code missing values: 999 or 99
Variable View —> Missing —> Discrete missing values 999
Missing 999

Codebook
1 Frequency distribution*
Analyze —> Descriptive Statistics —> Frequencies

2 Compute new variables
Transform —> Compute Variable
Target Variable: the name of the new variable
Numeric Expression: formula

or

Create new variables by recoding
Transform —> Recode into Di erent Variables
Numeric Variable -> Output Variable: variable
Output Variable: the name of the new variabele
—> Old and New Values

3 Missing values* (run on old variables)
Data —> Sort Cases (only if there are empty answers)
Data View —> Code missing values: 999
Variable View —> Missing —> Discrete missing values 999

4 Compute new variables*
Transform —> Compute Variable —> OK

5 Frequency distribution*
Analyze —> Descriptive Statistics —> Frequencies

A mean below zero indicates a general decrease in satisfaction and mean above zero indicates a
general increase.

Value labels
Variable View —> Values
Value: 1, 2, 3, etc.
Label: Satisfaction decreased (example)

Valid Percent
The percentage based on the situation in which the participants who did not answer this question
are omitted.

Scatter plot
Graphs —> Legacy Dialogs —> Scatter/Dot —> Simple Scatter
Output —> Graph —> dubbelklik —> Add Fit Line at Total

In general: the steeper the line, the stronger the correlation).


ff

Voordelen van het kopen van samenvattingen bij Stuvia op een rij:

Verzekerd van kwaliteit door reviews

Verzekerd van kwaliteit door reviews

Stuvia-klanten hebben meer dan 700.000 samenvattingen beoordeeld. Zo weet je zeker dat je de beste documenten koopt!

Snel en makkelijk kopen

Snel en makkelijk kopen

Je betaalt supersnel en eenmalig met iDeal, creditcard of Stuvia-tegoed voor de samenvatting. Zonder lidmaatschap.

Focus op de essentie

Focus op de essentie

Samenvattingen worden geschreven voor en door anderen. Daarom zijn de samenvattingen altijd betrouwbaar en actueel. Zo kom je snel tot de kern!

Veelgestelde vragen

Wat krijg ik als ik dit document koop?

Je krijgt een PDF, die direct beschikbaar is na je aankoop. Het gekochte document is altijd, overal en oneindig toegankelijk via je profiel.

Tevredenheidsgarantie: hoe werkt dat?

Onze tevredenheidsgarantie zorgt ervoor dat je altijd een studiedocument vindt dat goed bij je past. Je vult een formulier in en onze klantenservice regelt de rest.

Van wie koop ik deze samenvatting?

Stuvia is een marktplaats, je koop dit document dus niet van ons, maar van verkoper rubiluneta. Stuvia faciliteert de betaling aan de verkoper.

Zit ik meteen vast aan een abonnement?

Nee, je koopt alleen deze samenvatting voor €3,55. Je zit daarna nergens aan vast.

Is Stuvia te vertrouwen?

4,6 sterren op Google & Trustpilot (+1000 reviews)

Afgelopen 30 dagen zijn er 62774 samenvattingen verkocht

Opgericht in 2010, al 15 jaar dé plek om samenvattingen te kopen

Start met verkopen
€3,55  1x  verkocht
  • (0)
In winkelwagen
Toegevoegd