100% tevredenheidsgarantie Direct beschikbaar na betaling Zowel online als in PDF Je zit nergens aan vast
logo-home
BW3 Data Science with R summary €4,58
In winkelwagen

Samenvatting

BW3 Data Science with R summary

 96 keer bekeken  1 keer verkocht

Samenvatting van de Opbouw en basiskennis van het werken met het R softwarepakket en programmeertaal voor data analyse. Inhoud: > R en R studio: introduction, calculator, variable, projects, scripts > Data structures: install/use package, vectors, factors, list, formulas > Data manipu...

[Meer zien]
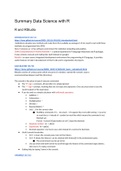
Voorbeeld 3 van de 16  pagina's

  • 6 oktober 2022
  • 16
  • 2021/2022
  • Samenvatting
Alle documenten voor dit vak (1)
avatar-seller
KaleyRozemarijn
Summary Data Science with R

R and RStudio

INTRODUCTION R (15/11)
https://lumc.github.io/rcourse/B3DS_202111/S01L02l_introduction0.html
Statisticians develop new methods and make them first available as packages in R (no need to wait until these
methods are programmed into SPSS)
Now R is known as “a free software environment for statistical computing and graphics.
CRAN (Comprehensive R Archive Network) = a central repository for R language interpreter and R packages.
It also contains manuals and mailing lists (well indexed on google)
Rstudio = an open source integrated development environment for programming in R language. It provides
useful features to help in development of the R code and in organization of projects.

CALCULATOR (15/11)
https://lumc.github.io/rcourse/B3DS_202111/S01L03l_basic_calculator0.html
RStudio consists of various panes which are parts of a window, namely the console, source,
environment(workspace) and files (directory).

The console is the place to type & execute commands
● The “#” sign = comment. All text after it is simply ignored
● The “>” sign = prompt, meaning that one van type any expression. One can press enter to see the
result (output) of the expression.
● R can be used as a simple calculator with arithmetic operators:
○ Addition: +
○ Subtraction: -
○ Multiplication: *
○ Division: /
○ Exponentiation: ^
○ Use (...) for the correct order
■ Multiline commands: If (.... too much → R expects the rest is still coming → no error
or result but a + instead of > symbol on next line which means the command is not
finished yet.
If error → press ESCape button or ctrl C stops the demand.
○ Absolute number: |x| = abs(x)
○ Squareroot: √x = sqrt(x)
○ Decimal separator: one has to use a dot instead of a comma for decimals.
● Useful console keystrokes:
○ Ctrl + L clears the console pane, but not the history.
○ Ctrl + R shows the history ( can be checked with history()) in the environment pane.
■ The environment can be set to list
○ Use up-arrow and down-arrow to scroll through the history of the commands types before;
click one to To replay command
● Getting help by typing ?name in the console

VARIABLE (15/11)

,https://lumc.github.io/rcourse/B3DS_202111/S01L04l_basic_variables0.html
A variable is an argument that stores a value or result.
Choose the names of variables freely. They are case sensitive so do use underscore “_” instead of dot.
Numbers are allowed except for at the beginning of the variable.
Typing the variables in the console creates a change in the environment pane after each ENTER.
The symbol “<-” is the assignment operator that puts a value/number/… to a variable.
fe: x <- 5 puts the number 5 in variable x
(one can also use the = sign but this is less common and one has to be consistent)
if the variable is the outcome of a calculation: x <- (calculation)

The variables are stored in R memory and RStudio shows them in the Environment pane (top right).
The scripts provide reproducibility (shows the calculation + answer).

PROJECTS (15/11)
https://lumc.github.io/rcourse/B3DS_202111/S01L05l_basic_projects0.html
At the start of every new data analysis project a new project is created in RStudio.
For every data analysis multiple files (input files/scripts/reports) have to be placed in the new R project folder
in order to use these.
Create a new project: Menu → File → new project → new directory → new project
- Give the Directory a name
- Choose where to create/store the directory
- (or→ New project: right upper corner)
Copy input files:
- download the datafiles to your computer
- go to verkenner and copy-paste the downloaded files into the project map
- the downloaded files should appear in the bottomright pane. (or otherwise search for the files in
‘files’ panel)


SCRIPTS (15/11)
https://lumc.github.io/rcourse/B3DS_202111/S01L06l_basic_scripts0.html
R script is a simple text file containing commands written in R language.
R Markdown document
An R Markdown document is an extension of an R script that enables the development of elegant and
reproducible reports.
The file is created through:
1. Menu → File → New file - R markdown - name it, html → (switch old/new view with the letter A top
right)
2. Save the file with name in the same map as the project map (and it will be shown in the file panel)
3. Knit the document: converts an R markdown document into a report file which is shown in the
bottom right pane.
→ When typing in console: R script stores all executed commands (typed in console) in a text
file directly in memory of R (local machine/computer). Sourcing = running a file in R
language.
→ When typing in markdown it does not appear in R environment; when pressing knit it is
copied in another document on computer.
Environment and knitting are not combined/do not communicate with each other
Knitting is the process of recalculating all lines/steps and checks the reproducibility (but is
very slow) and allows you to create a report (text document with commands in R language
and free text).

, - (Make sure tidyverse is installed)
R markdown is mixture of pretext and R code:
● Titles are indicated with # 1
● Subtitles are indicated with ## or ###
● - (minus) introduces bullet list
● Hyperlinked words [word](link) enables the isnertion of a datalink.
● ** … ** = bold words
● R code is typed in chunks
○ insert chunk (shortcut: Cntr + Alt + I)
○ Start with ```{r} and end with ``` (in between areas should become grey)
○ Vectors: v <-
○ Library(…)
■ Every time you want to run a program/package (make sure tidyverse is installed!!)
○ ```{r warning=FALSE,message=FALSE} to no longer see error messages
○ To ‘open’ csv files in markdown: read_csv (or read.csv)
○ To make new csv files use: write_csv(...)


Data structures

INSTALL/USE PACKAGES (15/11)
https://lumc.github.io/rcourse/B3DS_202111/S02L04l_packages0.html
R packages are a collection of related functions, possibly with data, built to tackle a specific problem. R comes
with several pre-installed packages such as base, stats, datasets etc. that cover basic data science exercises.
The Comprehensive R Archive Network, CRAN for short, is possibly the only one you need to know for now.
How to install packages
- type it into console pane: install.packages(“your-package-name”)
- or look it up in lower right pane ‘package’ searchbar
- or look at menu-tools and install package
How to load a package
- type in command in console: library(haven)

VECTORS (INTRODUCTION) (15/11)
https://lumc.github.io/rcourse/B3DS_202111/S02L03l_basic_vectors0a.html
A vector is a container of (multiple) elements at the same time:
- all elements are of the same type
- elements are kept at numbered positions
- elements might be given names
Types of data:
- Numerical: a vector of numbers (height of students)
- Character: a vector of texts (names of students)
- Logical: a vector of FALSE/TRUE values (if students have siblings)
- Factor: a vector of values from a limited choice list (eye color of students)

General:


1

Voordelen van het kopen van samenvattingen bij Stuvia op een rij:

Verzekerd van kwaliteit door reviews

Verzekerd van kwaliteit door reviews

Stuvia-klanten hebben meer dan 700.000 samenvattingen beoordeeld. Zo weet je zeker dat je de beste documenten koopt!

Snel en makkelijk kopen

Snel en makkelijk kopen

Je betaalt supersnel en eenmalig met iDeal, creditcard of Stuvia-tegoed voor de samenvatting. Zonder lidmaatschap.

Focus op de essentie

Focus op de essentie

Samenvattingen worden geschreven voor en door anderen. Daarom zijn de samenvattingen altijd betrouwbaar en actueel. Zo kom je snel tot de kern!

Veelgestelde vragen

Wat krijg ik als ik dit document koop?

Je krijgt een PDF, die direct beschikbaar is na je aankoop. Het gekochte document is altijd, overal en oneindig toegankelijk via je profiel.

Tevredenheidsgarantie: hoe werkt dat?

Onze tevredenheidsgarantie zorgt ervoor dat je altijd een studiedocument vindt dat goed bij je past. Je vult een formulier in en onze klantenservice regelt de rest.

Van wie koop ik deze samenvatting?

Stuvia is een marktplaats, je koop dit document dus niet van ons, maar van verkoper KaleyRozemarijn. Stuvia faciliteert de betaling aan de verkoper.

Zit ik meteen vast aan een abonnement?

Nee, je koopt alleen deze samenvatting voor €4,58. Je zit daarna nergens aan vast.

Is Stuvia te vertrouwen?

4,6 sterren op Google & Trustpilot (+1000 reviews)

Afgelopen 30 dagen zijn er 48756 samenvattingen verkocht

Opgericht in 2010, al 15 jaar dé plek om samenvattingen te kopen

Start met verkopen
€4,58  1x  verkocht
  • (0)
In winkelwagen
Toegevoegd