100% tevredenheidsgarantie Direct beschikbaar na betaling Zowel online als in PDF Je zit nergens aan vast
logo-home
Summary Economics of Health and Health Care - Health Economics, Policy & Law () €6,99
In winkelwagen

Samenvatting

Summary Economics of Health and Health Care - Health Economics, Policy & Law ()

 32 keer bekeken  1 keer verkocht

The summary includes all lectures including exercise lectures of the course Economics of Health and Health Care of the master Health Economics, Policy & Law. Good luck with studying!

Voorbeeld 4 van de 38  pagina's

  • 21 oktober 2022
  • 38
  • 2021/2022
  • Samenvatting
Alle documenten voor dit vak (8)
avatar-seller
MerelHoogstad
Economics of Health and Health Care – Health Economics, Policy & Law (GW4535M)
Merel Hoogstad


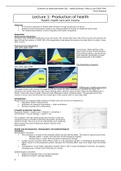
Lecture 1: Production of health
Health, health care and income
Objectives
 An economic approach of health determination through production functions;
 Empirical (and econometric) evidence on marginal effect of income on health at macro level;
 The relationship between income inequality and health (inequality).

Gapminder
World Income Distribution
Income is very unequally distributed across the world. The richest 20% have 74% of the income, the poorest 2%
have 20% of the income. In 2000 19% of the population lived below the poverty line (less than $1 a day), it was
38% in 1970.

Regional Income Distribution
Left: 1970, right: 2000
Conclusions: OECD getting richer,
major parts of Asia moving forward,
Africa falling behind, Latin Americas
wide disparity and Eastern Europe
going backwards in the 1990’s.


The distribution of poverty
Left: 1970, right: 2000


Differences in health and income
The graph shows child survival (%) against GDP per capita ($). With continents or countries as input, the
outcome is an almost linear line. But, when looking closer: with the same income, there are big differences in
health. If you look more in detail, there are high differences within countries either. The poorest part of the
country is much more low-left than the richest part of the country with is more high-right.

Introduction
Measurement of marginal health product of health care and income is hampered by:
 Population health measurement.
 Estimation of marginal contribution  total contribution.
 Reverse causality and confounding.

A health production function
Population health = health care + lifestyle + schooling +
environment + human biology + genes + etc.

The ‘problem’ with the health production function is that the
marginal product of health investment decreases: diminishing
returns to scale. This can go on to a flat-of-the-curve medicine,
which means that more investment doesn’t lead to more
improvement.

Health and development: demographic and epidemiological
transition
Demographic transition:
 This transition is a result of the mortality effect and the fertility effect. This leads to age-structure shift.
o Mortality effect = longer lives because of technological progress.
o Fertility effect = fewer births because of behavioral change.
 In high-income countries these effects result in a 2% population growth. In developing countries these
effects result in a 4% population growth, because the mortality effect was much larger than the fertility
effect.
 Consequence: much higher population growth rates in LDC’s (Least Developed Countries), but ageing
consequences in others (one child policy in China).

Epidemiological transition:
 Expensive diseases drive out cheap diseases.
 Relative increase in old-age diseases.

1

, Economics of Health and Health Care – Health Economics, Policy & Law (GW4535M)
Merel Hoogstad


Summarizing the historical evidence of mortality decline
1. Phase 1 (1750-1850): nutrition (with economic growth). Half of all mortality decline in late 18 th century
due to increased caloric intake and growth in height.
2. Phase 2 (1850-1930): public health: mainly cleaner water in cities and better sanitation.
3. Phase 3 (1930-2000): medical care: first vaccines (many declines in infect dis mortality occurred before
introduction of effective vaccines) and antibiotics, later ‘big medicine’ (two-third of cardiovascular
mortality decline due to medical advances).

Income and health relationship in poor(er) countries
Very strong association between income and health, but what does that mean for policy? Is it the implication
that one has to await income growth and development for improved population health? Or that they go hand in
hand for other (unobserved) reasons? Does all income growth result in better health? So, is wealthier always
healthier? Let’s take a look at some evidence from econometric analysis.

Income and health linkages: early evidence
Concave curve in the association between health and income.
This curve has shifted upward over the last century due to
technological improvements which leads to cheaper health
production, income distribution changed and you can do a lot
more with your money within 100 years.

Income can’t directly generate health, but it can be used for
health-enhancing goods. Health gains are smaller in high-
income countries (flat-of-the-curve).

Preston curve = concave relationship between income and life
expectancy. Meaning that an average life expectancy across
incomes < life expectancy of those with average incomes.

Empirical analysis of income-health relationships and
articles
Kakwani model: hi =α + β∗log ( y i ) +ε i.
 Strong positive income elasticities of population health, but falling with rising income.

Anand & Revallion model: hi =α + β∗log ( y i ) +γ Z i +ε i .
 They used information of 22 countries in 1993.
 When controlling for other (Zi) factors, in particular the poverty rate and public health expenditure per
capita, income becomes insignificant.

Pritchett & Summers model: log ( h¿ )=α i + β∗log ( y ¿ )+ γ X ¿ +δ t +ε ¿ .
 They used panel data analysis of 60 developing countries in the period of 1960-1985 and had
information about infant- and child mortality.
 α i = allows for country-specific fixed effects and δ t = allows for time-specific effects.
 They estimated a causal effect between income and life expectancy, so wealthier is healthier.

Cutler, Deaton et al.: income-health association is strong, both between and within countries, however wealthier
doesn’t always mean healthier. The adoption of knowledge, science and technology are key.

Income and health in rich countries: flat-of-the-curve reached?
1. Mortality is not the gauge (graadmeter), it’s about quality of life.
2. Wilkinson income inequality hypothesis: it is about (re)distribution of income rather than the level of
income. Wilkinson states that with lower inequality, the life expectancy increases. Critique from
Snowdon: The Spirit Level Delusion (no association) = when you add some more countries, the
conclusions are different, maybe there is no or even a positive association. You can only confirm the
concave relationship with health and income, but you cannot state that higher inequality leads to lower
life expectancy.
3. There is some morality that we can’t do anything against, so there are two ways of mortality:
a. Mortality that is amenable to health care.
b. Mortality we don’t have influence on (for example: accidents).


2

, Economics of Health and Health Care – Health Economics, Policy & Law (GW4535M)
Merel Hoogstad


With a concave relationship (health at y-axis) at the With a convex relationship (mortality on y-axis) at
individual level, lower inequality means a higher the cross-country level, lower inequality means lower
health outcome. mortality.

The rich person has income yA and the poor person The mortality increase from the poor is bigger (m1A --
has income yB. On average they have  income. You > m1B) than the mortality decreases from the rich
can see that that results in h0. By taking away 100 (m2A --> m2B). On average the mortality increases
euros of income for the rich person and give it to the from mA --> mB.
poor person, the result is h1.

Conclusions
 Economics focuses on ‘contribution’ of health determinants ‘at the margin’ = what you get extra or
what you lose when you make margin changes in health care investments.
 Concavity of Preston curve suggests decreasing marginal returns of income and health investment.
 Economic growth usually associated with, but no guarantee for, health gains.
 Economic growth may also increase health inequality by income.
 Adequate adoption of new knowledge and technology appear to be key for improvement of both.
 No flat-of-the-curve for avoidable mortality.
 Greater income inequality associated with lower mean health in concave relationship, but not causal.


3

, Economics of Health and Health Care – Health Economics, Policy & Law (GW4535M)
Merel Hoogstad


Lecture 2: Demand for health
Health, health care and income
Objectives:
 A (graphical) explanation of the demand for health theory.
 Economic theory that may help guide empirical research on health and income.
 The relationship between income growth and health (inequality) at macro level.

In the previous lecture, we saw that income and health are associated. Some studies even claim causal effect of
economic growth, but others claim that growth is neither necessary nor sufficient condition for health
improvement. In this lecture: can theory help us predict what to expect?

Introduction to a theory of health capital
Four crucial observations of Grossman:
1. Consumer want health, not health care, but not only health (also holiday, restaurants, sports etc.).
2. Health can’t be purchased directly, while medical care can. Health can be produced, using time and
health-improving efforts (like health care, exercise, nutrition).
3. Health is a stock of human capital, which lasts for more than one period, but depreciates (= meer
waarderen) over time. Everyone is born with health, but it will decrease over time, when people get
older.
4. Health is both a consumption good (where you feel direct results when you have good health) and an
investment good (you can invest in health and can perform better in work and have more leisure time
if you invest in good health).

Theory helps to explain and understand why some people/groups are healthier than others. Theory = The
Grossman model.
 Health inequality = income-related health inequality = not the difference in health, but being a poor or
rich person results in being healthy or not.
 Four-quadrant diagrams can help explain effect of education, income, age, etc.:


 Q1: concave production of health (H) with How to choose optimal health given a budget
medical care (M). The production of health constraint?
shows a reduce in the marginal returns to This persons optimal choose will be HA0 and MA0, you
scale. can also see the amount of C in the graph.
 Q2: demand for health (H) vs other
consumption (C) determined by
preferences as shown in the utility curve.
 Q4: income available for medical care (M)
and other consumption (C) defines budget
constraint BCA0.

The goal is maximization of utility (U), given income
(BC) and production possibilities defines optimum
HA0.


This theory can help us to understand why richer people are more likely to be healthier, to what happens to
health inequality when income disparities increase, to why (and when) do richer countries also have greater
health inequality and what happens to health inequalities when medical care is subsidized (more) for the poor.


4

Voordelen van het kopen van samenvattingen bij Stuvia op een rij:

Verzekerd van kwaliteit door reviews

Verzekerd van kwaliteit door reviews

Stuvia-klanten hebben meer dan 700.000 samenvattingen beoordeeld. Zo weet je zeker dat je de beste documenten koopt!

Snel en makkelijk kopen

Snel en makkelijk kopen

Je betaalt supersnel en eenmalig met iDeal, creditcard of Stuvia-tegoed voor de samenvatting. Zonder lidmaatschap.

Focus op de essentie

Focus op de essentie

Samenvattingen worden geschreven voor en door anderen. Daarom zijn de samenvattingen altijd betrouwbaar en actueel. Zo kom je snel tot de kern!

Veelgestelde vragen

Wat krijg ik als ik dit document koop?

Je krijgt een PDF, die direct beschikbaar is na je aankoop. Het gekochte document is altijd, overal en oneindig toegankelijk via je profiel.

Tevredenheidsgarantie: hoe werkt dat?

Onze tevredenheidsgarantie zorgt ervoor dat je altijd een studiedocument vindt dat goed bij je past. Je vult een formulier in en onze klantenservice regelt de rest.

Van wie koop ik deze samenvatting?

Stuvia is een marktplaats, je koop dit document dus niet van ons, maar van verkoper MerelHoogstad. Stuvia faciliteert de betaling aan de verkoper.

Zit ik meteen vast aan een abonnement?

Nee, je koopt alleen deze samenvatting voor €6,99. Je zit daarna nergens aan vast.

Is Stuvia te vertrouwen?

4,6 sterren op Google & Trustpilot (+1000 reviews)

Afgelopen 30 dagen zijn er 53340 samenvattingen verkocht

Opgericht in 2010, al 14 jaar dé plek om samenvattingen te kopen

Start met verkopen
€6,99  1x  verkocht
  • (0)
In winkelwagen
Toegevoegd