100% tevredenheidsgarantie Direct beschikbaar na betaling Zowel online als in PDF Je zit nergens aan vast
logo-home
Summary for the course, statistical methods at VU. €6,99   In winkelwagen

Samenvatting

Summary for the course, statistical methods at VU.

 40 keer bekeken  1 keer verkocht

This summary captures all lecture video's (in the year , during the COVID breakout) of the statistical methods course, given in the second year of the bachelor AI. It captures all video's, however some examples are often not included, and some are.

Voorbeeld 4 van de 54  pagina's

  • 29 oktober 2022
  • 54
  • 2020/2021
  • Samenvatting
Alle documenten voor dit vak (3)
avatar-seller
freekcool
Video 2, R
● (1:2) means a vector.
● or (x=1:3) means x has the values 1 to 3
● We can plot with plot(x=1:3, foo(1:3)) for example.
● With help(“ “) you can search documentation for certain functions and functionalities.
● With type=”l” you get a line in the plot.
● main=”...” enables to give a title to the plot.
● xlab and ylab enables us to specify labels on the y and x axis.
● rnorm(10) givus us 10 random numbers for a normal distribution.
○ To keep the same values instead of having everytime new ones, use
set.seed()
● t-tests we do with t.test()
● par(mfrow=c(2,2)) means we have 2 plots next to each other plotted, which is handy
for comparing things.

Video 3, statistics and critical thinking
What is statistics?
● Statistics is the science of data:
○ The study of collecting, organising, analysing, interpreting and presenting
data.
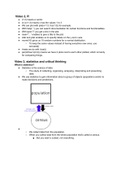
● We use statistics to gain information about a group of objects (population) and/or to
make decisions and predictions.


○ We collect data from the population.
○ When you collect data from the whole population that’s called a census.
■ But you want a subset, not everything.

, ■
● We draw conclusions from the sample.
● The sample has to be a representation of the population.
● A statistical study has 3 parts:
○ Prepare
■ context
■ Source
■ Sampling method
○ Analyse
■ Graph data
■ Explore data
■ Apply statistical methods
○ Conclude
● Doing statistics requires critical thinking.


○ Common flaw is having a bad sampling method.
■ You should choose a method such that the sample from the population
represents the population.
■ Sample is a subcollection of a population, so different samples →
different data.
● Hence possibly different conclusions about population.
■ A sample should be representative (same characteristics as
population) and unbiased (no systematic difference with population).
● Then we should have the same data as we would have used
the whole population.
○ Another flaw:

, ■
■ The difference here seems quite large, but that’s because the y-axis
does not begin at 0.
○ Another flaw:
■ Correlation does not imply causation.
■ Other variables can influence a correlation.

Video 4, statistics and critical thinking
Collecting sample data
● Voluntary response sample:
○ Subjects decide themselves to be included in sample.
○ But is biased, because only people who feel like it answer.
● Random sample:
○ Each member of population has equal probability of being selected.
○ Is unbiased and gives a better representation of the population.
● Simple random sample:
○ Each sample of size n has equal probability of being chosen.
○ Is unbiased
○ But hard to do in practice when you for example have a very large population.
● Systematic sampling:
○ After starting point, select every k-th member.
○ It is easy to manipulate the outcome.
■ This makes it dangerous because outcomes can be influenced.
● Stratified sampling:
○ Divide population into subgroups such that subject within groups have same
characteristics, then draw a (simple) random sample from each group.
● Cluster sampling:
○ Divide population into clusters, then randomly select some of the clusters.
○ May lead to biased data which not represents the data.
■ To decrease the risk it is important to have a large dataset.
● Convenience sampling:
○ Easily available results
○ For example family

Part 2, important concepts:
● Variable:

, ○ Varying quantity
● In cause and effect studies:
○ Response (dependent) variable:
■ Representing the effect to study
○ Explanatory (independent) variable:
■ Possibly causing that effect
○ Confounding:
■ Mixing influence of several explanatory variables on response.


■ It is very important to investigate the significance of the confounding
variables.

Video 5, types of data
Part 2 different types of study:
● Observational study:
○ Characteristics of subjects are observed; subjects are not modified.
○ Retrospective (case-control): data from past
○ Cross-sectional: data from one point in time.
○ Prospective (longitudinal): data are to be collected.
● Experiment: some subject treatment
○ Sometimes control and treatment group: single-blind or double blind,
○ To measure placebo effect or experimenter effect.

Types of data
● Parameter:
○ Numerical measurement describing a population’s characteristic.
○ Notation: typically Greek symbols.
● Statistic:
○ numerical measurement describing a sample’s characteristic.
○ Notation: small letters like x and s.

Voordelen van het kopen van samenvattingen bij Stuvia op een rij:

Verzekerd van kwaliteit door reviews

Verzekerd van kwaliteit door reviews

Stuvia-klanten hebben meer dan 700.000 samenvattingen beoordeeld. Zo weet je zeker dat je de beste documenten koopt!

Snel en makkelijk kopen

Snel en makkelijk kopen

Je betaalt supersnel en eenmalig met iDeal, creditcard of Stuvia-tegoed voor de samenvatting. Zonder lidmaatschap.

Focus op de essentie

Focus op de essentie

Samenvattingen worden geschreven voor en door anderen. Daarom zijn de samenvattingen altijd betrouwbaar en actueel. Zo kom je snel tot de kern!

Veelgestelde vragen

Wat krijg ik als ik dit document koop?

Je krijgt een PDF, die direct beschikbaar is na je aankoop. Het gekochte document is altijd, overal en oneindig toegankelijk via je profiel.

Tevredenheidsgarantie: hoe werkt dat?

Onze tevredenheidsgarantie zorgt ervoor dat je altijd een studiedocument vindt dat goed bij je past. Je vult een formulier in en onze klantenservice regelt de rest.

Van wie koop ik deze samenvatting?

Stuvia is een marktplaats, je koop dit document dus niet van ons, maar van verkoper freekcool. Stuvia faciliteert de betaling aan de verkoper.

Zit ik meteen vast aan een abonnement?

Nee, je koopt alleen deze samenvatting voor €6,99. Je zit daarna nergens aan vast.

Is Stuvia te vertrouwen?

4,6 sterren op Google & Trustpilot (+1000 reviews)

Afgelopen 30 dagen zijn er 82871 samenvattingen verkocht

Opgericht in 2010, al 14 jaar dé plek om samenvattingen te kopen

Start met verkopen
€6,99  1x  verkocht
  • (0)
  Kopen