Solution Manual for Statistics for Nursing Research A Workbook for Evidence-Based Practice, 3rd Edition, Susan Grove, Daisha Cipher Answer Guidelines for Questions to Be Graded Identifying Levels of EXERCISE Measurement: Nominal, 1 Ordinal, Interval, and Ratio The questions are in bold followed by ...
solution manual for statistics for nursing research a workbook for evidence based practice
Geschreven voor
Pennsylvania State University
Tes (TESTBANK)
Alle documenten voor dit vak (2)
1
beoordeling
Door: rachelhingson • 2 maanden geleden
Verkoper
Volgen
ELITESOLUTIONS
Ontvangen beoordelingen
Voorbeeld van de inhoud
Answer Guidelines for Questions to Be Graded
Identifying Levels E XE RC IS E
of Measurement:
Nominal, Ordinal,
1
Interval, and Ratio
The questions are in bold followed by answers.
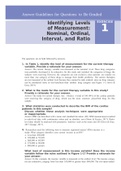
1. In Table 1, identify the level of measurement for the current therapy
variable. Provide a rationale for your answer.
Answer: The current therapy variable was measured at the nominal level. These drug categories
were probably developed to be exhaustive for this study and included the categories of drugs the
subjects were receiving. However, the categories are not exclusive, since patients are usually on
more than one category of these drugs to manage their health problems. The current therapies
are not measured at the ordinal level because they cannot be rank ordered, since no drug category
can be considered more or less beneficial than another drug category (see Figure 1-1; Grove &
Gray, 2019).
2. What is the mode for the current therapy variable in this study?
Provide a rationale for your answer.
Answer: The mode for current therapy was blocker. A total of 100 (94%) of the cardiac patients
were receiving this category of drug, which was the most common prescribed drug for this
sample.
3. What statistics were conducted to describe the BMI of the cardiac
patients in this sample?
Discuss whether these analysis techniques were appropriate
or inappropriate.
Answer: BMI was described with a mean and standard deviation (SD). BMI measurement resulted
in ratio-level data with continuous values and an absolute zero (Stone & Frazier, 2017). Ratio-
level data should be analyzed with parametric statistics such as the mean and SD (Grove & Gray,
2017; Knapp, 2017).
4. Researchers used the following item to measure registered nurses’ (RNs) income in a
study: What category identifies your current income as an RN?
a. Less than $50,000
b. $50,000 to 59,999
c. $60,000 to 69,999
d. $70,000 to 80,000
e. $80,000 or greater
What level of measurement is this income variable? Does the income
variable follow the rules outlined in Figure 1-1? Provide a rationale for
your answer.
Answer: In this example, the income variable is measured at the ordinal level. The income catego-
ries are exhaustive, ranging from less than $50,000 to greater than $80,000. The two open-ended
,AG 1-1
,AG 1-2 Answer Guidelines for Questions to Be Graded
categories ensure that all salary levels are covered. The categories are not exclusive, since catego-
ries (d) and (e) include an $80,000 salary, so study participants making $80,000 might mark
either (d) or (e) or both categories, resulting in erroneous data. Category (e) could be changed
to greater than $80,000, making the categories exclusive. The categories can be rank ordered
from the lowest salary to the highest salary, which is consistent with ordinal data (Grove &
Gray, 2019; Waltz et al., 2017).
5. What level of measurement is the CDS score? Provide a rationale for
your answer.
Answer: The CDS score is at the interval level of measurement. The CDS is a 26-item Likert
scale developed to measure depression in cardiac patients. Study participants rated their symp-
toms on a scale of 1 to 7, with higher numbers indicating increased severity in the depression
symptoms. The total scores for each subject obtained from this multi-item scale are considered
to be at the interval level of measurement (Gray et al., 2017; Waltz et al., 2017).
6. Were nonparametric or parametric analysis techniques used to analyze
the CDS scores for the cardiac patients in this study? Provide a
rationale for your answer.
Answer: Parametric statistics, such as mean and SD, were conducted to describe CDS scores
for study participants (see Table 1). CDS scores are interval-level data as indicated in Questions 5,
so parametric statistics are appropriate for this level of data (Gray et al., 2017; Kim & Mallory,
2017).
7. Is the prevalence of depression linked to the NYHA class? Discuss the
clinical importance of this result.
Answer: The study narrative indicated that the prevalence of depression increased with the
greater NYHA class. In NYHA class III, 64% of the subjects were depressed, whereas 11% of the
subjects were depressed in NYHA class I. Thus, as the NYHA class increased, the number of sub-
jects with depression increased. This is an expected finding because as the NYHA class increases,
cardiac patients have more severe physical symptoms, which usually result in emotional distress,
such as depression. Nurses need to actively assess cardiac patients for depression, especially those
in higher NYHA classes, so they might be diagnosed and treated as needed.
8. What frequency and percent of cardiac patients in this study were not
being treated with an antidepressant? Show your calculations and
round your answer to the nearest whole percent (%).
Answer: A total of 106 cardiac patients participated in this study. The sample included
15 patients who were receiving an antidepressant (see Table 1). The number of cardiac
patients not treated for depression was 91 (106 – 15 91). The group percent is calculated
by the following formula: (group frequency total sample size) 100%. For this study,
(91 patients 106 sample size) 100% 0.858 100% 85.8% 86%. The final
answer is rounded to the nearest whole percent as directed in the question. You could have
also subtracted the 14% of patients treated with antidepressants from 100% and obtained the
86% who were not treated with an antidepressant.
9. What was the purpose of the 6-minute walk test (6MWT)? Would the
6MWT be useful in clinical practice?
Answer: Ha et al. (2018) stated, “The 6-min walk test (6MWT) is a measure of the submaximal,
steady-state functional capacity” of cardiac patients. This test would be a quick, easy way to
determine a cardiac patient’s functional status in a clinical setting. This functional status
score could be used to determine the treatment plan to promote or maintain functional status
of cardiac patients.
, Answer Guidelines for Questions to Be Graded AG 1-3
10. How was exercise confidence measured in this study? What was the
level of measurement for the exercise confidence variable in this study?
Provide a rationale for your answer. Answer: Exercise confidence of the patients
with heart failure (HF) in this study was measured with the Exercise Confidence Scale that
included four subscales focused on walking, climbing, lifting objects of graded weight, and
running (see the study narrative). This was a rating scale with values ranging from 0 to 100.
The patients’ scores for the Total Exercise Confidence scale and the subscales were considered
interval-level data and analyzed with parametric statistics, such as means and SDs (see the
study narrative; Waltz et al., 2017).
Voordelen van het kopen van samenvattingen bij Stuvia op een rij:
Verzekerd van kwaliteit door reviews
Stuvia-klanten hebben meer dan 700.000 samenvattingen beoordeeld. Zo weet je zeker dat je de beste documenten koopt!
Snel en makkelijk kopen
Je betaalt supersnel en eenmalig met iDeal, creditcard of Stuvia-tegoed voor de samenvatting. Zonder lidmaatschap.
Focus op de essentie
Samenvattingen worden geschreven voor en door anderen. Daarom zijn de samenvattingen altijd betrouwbaar en actueel. Zo kom je snel tot de kern!
Veelgestelde vragen
Wat krijg ik als ik dit document koop?
Je krijgt een PDF, die direct beschikbaar is na je aankoop. Het gekochte document is altijd, overal en oneindig toegankelijk via je profiel.
Tevredenheidsgarantie: hoe werkt dat?
Onze tevredenheidsgarantie zorgt ervoor dat je altijd een studiedocument vindt dat goed bij je past. Je vult een formulier in en onze klantenservice regelt de rest.
Van wie koop ik deze samenvatting?
Stuvia is een marktplaats, je koop dit document dus niet van ons, maar van verkoper ELITESOLUTIONS. Stuvia faciliteert de betaling aan de verkoper.
Zit ik meteen vast aan een abonnement?
Nee, je koopt alleen deze samenvatting voor €14,28. Je zit daarna nergens aan vast.