What is covered?
- Basic of statistics
- the one-sample T-test
- the independent sample T-test
- one-way-between-subjects analysis of variance (ANOVA)
- Bivariate pearson correlation
- Bivariate regression
- Adding a third variable
- Multiple regression analysis with 2 predictors
- Du...
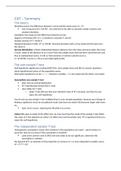
CAT – Summary
The basics
Deviation scores: the difference between 1 score and the mean score: X – M
Sum of squares (SS): (X-M)². You need this to be able to calculate sample variance and
standard deviation.
Variability: how large are the differences between scores.
Degrees of freedom (DF): N-1, is needed to calculate S² and SD.
Sample variance (S²) = SS/(N-1)
Standard deviation (S/SD): √S² or √SS/DF. Standard deviation tells us how dispersed the data from
the mean is.
Normal distribution: a fixed relationship between distance from the mean and area under the curve.
Z-score: index of the distance of an x-score from the sample mean that has been converted into unit
free or standardized scores. It tells us how extreme or normal a certain score is.
Z = (X-M)/SD. Z-score is 1.96 at a two tailed alpha 0.025.
The one-sample T-test
Null-hypothesis significance testing (NHST/H0): uses sample mean and SEm to answer questions
about hypothesized values of the population mean.
Alternative hypothesis can be: , >, < between variables. is two-tailed and the others one-tailed.
Assumptions one-sample T-test
Does not use normal distribution
(M- hypothesized mean)/SEm is used
Uses tables for T-ratio
o Large T-rate tells you that your obtained value of M is unusual, and that you can
reject the null-hypothesis.
You do not use one-sample T-test multiple times in your sample population, because your change of
finding a significant result (an exceptional result, that does not match H0) becomes larger with every
try.
Type I error occurs: rejecting the H0 while it is correct.
Cohen’s D: gives an index of the effect size. So, how much has the result of the sample-T-test effect.
The value of T-test depends on Cohen’s D (effect size) and N (sample size). If T is significant then you
reject the null-hypothesis.
The independent-sample T-test
Homogeneity assumption: means that variation in the populations are equal – equal variance is
assumed. How do you know if this assumption is violated?
Look at the Levene’s test in SPSS: the test needs to be not significant, otherwise this
assumption is violated.
Eta Squared (N²): an estimate of the proportion of variance in 1 or more dependent variable scores.
N² = T²/T² + DF
,One-way-between-subjects analysis of variance (ANOVA)
ANOVA: Is used to analyse one or more variables. It looks if these group averages differ from the
population average.
It cannot tell which group (sample) differs, but only that it does or does not.
You can look at the variance within groups, and the variance between groups.
F-distribution is used.
Assumption of ANOVA:
Quantitative dependent variable of interval/ratio (continuous) measurement level.
Independent variable of nominal measurement level.
In the full sample and in each group, scores of the dependent variable are approximately
normally distributed.
No outliers
Variances of scores of dependent variables is equal between groups. Homogeneity is
assumed.
Observations have been selected by random sampling and are independent.
Yij = individual score
My = population mean
Mi = group mean
αi = difference between group average and population mean
SSbetween = (MI – MY)² SSwithin = (YIJ – MI)²
F-ratio test statistic = MS between/MSwithin
MSbetween = SSbetween/(k-1)
MSwithin = SSwithin/DF1
K = number of groups
F-critical value = look up in table
If the F-ration larger is than the critical value then you reject the null hypothesis
F-critical value determines when a number is significant in the sample population
Levene’s test: if the test is significant then that means that there is not equal population variance.
Which means that you have violated the homogeneity assumption. Which means that you cannot
use the F-test. If it is not significant you can look at the F-test and P-value, if this is significant than
the means of the groups vary, if it is not significant you accept the Null-hypothesis. You have to look
at the Welch-test or Brown-Forsythe test, to know if you ANOVA test is significant.
Effect of the group: Ak = Mk (mean of random score)– My (total mean)
, Bivariate Pearson correlation <-->
Assumptions of Pearson’s correlation
Variables are quantitative or both dichotomous
Variables are linearly related
Variables have a bivariate normal distribution
No extreme outliers otherwise value of R can be inflated or deflated by outliers.
Homoscedasticity: Y-scores have the same variance across level of X, and vice versa.
Heteroscedasticity is varying variance
Pearson’s R is used to describe the strength of a linear relationship. It is always 1 or -1
Standardized
Always between 2 continuous/dichotomous variables
If x increases, than Y increases.
When there is no linear association, that does not mean that there can’t be another kind of
association
Computation of Pearson’s R:
1. Convert scores X on Y to Z-scores (unit free)
a. Zx = (X – MX)/Sx
b. Zy = (Y-MY)/Sy
2. Multiply Zx X Zy for each score
3. Sum of each score = Zx x Zy
4. Zx x Zy /N-1 = R
Testing H0:P0 = 0 no correlation between X and Y
P: population value of the correlation
Ratio fort = T = R-P0/SEr SEr = √1-r²/ √N-2
How to limit type 1 error in correlations:
Limit the number of correlations
Cross-validation
Bonferroni (a/k (significance test). This lowers the significance level
Replicate correlations in new samples.
Factors that influence magnitude of R:
Pearson’s R will be deflated if X and Y are non-linear or curvilinear
Pearson’s R can be used as a standardized regression coefficient to predict the standard
score on Y from the standard score on X, vice versa. Z’y = Rx x Zx this says that if X is 1
standard deviation from its mean, then Y will be R-standard deviations units from the mean.
A perfect R-score (so, 1) can only occur when X and Y have the same SD (distribution shape) this does
not occur a lot. When it does than R cannot be used as a regression coefficient. The mean, variance
and distribution shape of scores should be similar to the mean of the population.
Samples that include members of different groups can provide misleading or confusing
information
If X has poor measurement reliability, it’s correlations with other variables will be attenuated
(Reduced) magnitude of attenuation: Rxy = Pxy √Rxx x Ryy. Rxy is observed correlation
between x and y. Pxy is real correlation (Without errors). Rxx x ryy is reliability of the
variables.
Do not have the same survey questions
Voordelen van het kopen van samenvattingen bij Stuvia op een rij:
Verzekerd van kwaliteit door reviews
Stuvia-klanten hebben meer dan 700.000 samenvattingen beoordeeld. Zo weet je zeker dat je de beste documenten koopt!
Snel en makkelijk kopen
Je betaalt supersnel en eenmalig met iDeal, creditcard of Stuvia-tegoed voor de samenvatting. Zonder lidmaatschap.
Focus op de essentie
Samenvattingen worden geschreven voor en door anderen. Daarom zijn de samenvattingen altijd betrouwbaar en actueel. Zo kom je snel tot de kern!
Veelgestelde vragen
Wat krijg ik als ik dit document koop?
Je krijgt een PDF, die direct beschikbaar is na je aankoop. Het gekochte document is altijd, overal en oneindig toegankelijk via je profiel.
Tevredenheidsgarantie: hoe werkt dat?
Onze tevredenheidsgarantie zorgt ervoor dat je altijd een studiedocument vindt dat goed bij je past. Je vult een formulier in en onze klantenservice regelt de rest.
Van wie koop ik deze samenvatting?
Stuvia is een marktplaats, je koop dit document dus niet van ons, maar van verkoper evaprincen. Stuvia faciliteert de betaling aan de verkoper.
Zit ik meteen vast aan een abonnement?
Nee, je koopt alleen deze samenvatting voor €6,94. Je zit daarna nergens aan vast.