A summary of the Physical Science Grade 9 content including the scientific method, the atom and the periodic table, electrons in an atom, chemical formulae, chemical equations, reactions in oxygen, acids and bases, forces and motion. Everything you need in one go!
Scientific Method
Is an organised plan for gathering, organizing, communicating information?
Goal: To solve a problem or to better understand an observed event
Approaching problems using scientific thinking, allows us to evaluate problems and
solutions rationally separate from untestable emotions and opinions
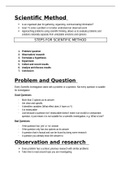
STEPS FOR SCIENTIFIC METHOD
1. Problem/ question
2. Observation/ research
3. Formulate a hypothesis
4. Experiment
5. Collect and record results
6. Analyse and discuss results
7. Conclusion
Problem and Question
Every Scientific Investigation starts with a problem or a question. Not every question is suitable
for investigation
Good Questions
- More than 2 options as its answer
- Are clear and specific
- It identifies variables (What effect does X have on Y)
- It is measurable
- Just because a question isn’t measurable doesn’t make it an invalid or unimportant
question, it just means it is not suitable for a scientific investigation, e.g. What is love?
Bad Questions
- If the question has ‘yes’ or ‘no’ answer
- If the question only has two options as its answer
- A question that is factual and can be found by doing some research
- A question you already know the answer to
Observation and research
Every problem has a context, previous research with similar problems
Take time to read around topic you are investigating
, Find that further questions develop, experimental design improves, you find your
answer
To discover new knowledge, develop/ confirm our current knowledge, understanding
Not simply about just doing an experiment!
Formulate a hypothesis
Is a predicted answer to the investigative question
Must be in the form of a statement
Must give a predicted relationship between the variables
THE INDEPENDENT AND DEPENDENT VARIABLES MUST FORM THE BASIS OF THE
HYPOTHESIS
Independent/ Manipulated variable – factor that intentionally varied by the experimenter
(changed variable)
Dependent/ Responding variable – factor that may change because of changes made in the
independent variable (measured variable)
Examples of strong hypotheses:
A hypothesis focuses ‘a scientists’ thinking
- It is expected growth rates for petunias will decrease with increased water salinity
provided all other growth conditions are constant.
- Pressure in a fixed volume increases with increased temperature
NB* A hypothesis does not have to right or wrong it is just what you think the observed
relationship will be
Examples of weak hypotheses:
- I think blue is nicer than pink
- Men are better drivers because they are more logical
- The sky is blue because light is refracted through water molecules
Controlled variables and control
experiments
Control Variables:
- All the factors that could potentially affect the dependent variable must be kept constant, so
they have no impact on our data.
- Critical that all potential variables are identified, managed.
- This is a key component of good experimental design!
*Not the apparatus
, A Control Experiment:
- Experimental group that is identical to experimental group but not subjected to
independent variable change
- E.g. When testing a new medicine one group is given the drug, another group with the
same disease is given nothing. The two groups are then compared, if the outcome is
different with the group that was given the drug then the result is valid.
Aim vs Hypothesis
Hypothesis: Predicted relationship between two variables (Use the aim to form the hypothesis)
Aim: Does not state a relationship, states an expected outcome for experiment
E.g. To find the concentration of the solution
Collect and Record data
All relevant evidence is recorded
Data can be presented in variety of forms:
Graphs
Tables
Observation sheets
Photographs and video
Statistical modelling
And many more
Analyse and discuss results
(Where there is the most marks) EXPLAINATION
- Place for the experimenters to analyse the data
- Analyse is done by:
Observing and noting trends (Patterns) in the data
Any flaws in the experimental method
Suggestions for improvement (Its fine if there’s things wrong or if things go
wrong in an experiment)
Suggesting possible reasons for trends by drawing on current scientific theory
– goes in discussion of results
Conclusion
Final answer (Don’t repeat yourself, don’t repeat what you put in analyse in conclusion)
- Based on the analyse of the data, the hypothesis is either accepted or rejected
- No discussion or reasoning is included here
- NB! The goal is not to be right or wrong, the goal is the validity
of your conclusion
Voordelen van het kopen van samenvattingen bij Stuvia op een rij:
Verzekerd van kwaliteit door reviews
Stuvia-klanten hebben meer dan 700.000 samenvattingen beoordeeld. Zo weet je zeker dat je de beste documenten koopt!
Snel en makkelijk kopen
Je betaalt supersnel en eenmalig met iDeal, creditcard of Stuvia-tegoed voor de samenvatting. Zonder lidmaatschap.
Focus op de essentie
Samenvattingen worden geschreven voor en door anderen. Daarom zijn de samenvattingen altijd betrouwbaar en actueel. Zo kom je snel tot de kern!
Veelgestelde vragen
Wat krijg ik als ik dit document koop?
Je krijgt een PDF, die direct beschikbaar is na je aankoop. Het gekochte document is altijd, overal en oneindig toegankelijk via je profiel.
Tevredenheidsgarantie: hoe werkt dat?
Onze tevredenheidsgarantie zorgt ervoor dat je altijd een studiedocument vindt dat goed bij je past. Je vult een formulier in en onze klantenservice regelt de rest.
Van wie koop ik deze samenvatting?
Stuvia is een marktplaats, je koop dit document dus niet van ons, maar van verkoper AL0803. Stuvia faciliteert de betaling aan de verkoper.
Zit ik meteen vast aan een abonnement?
Nee, je koopt alleen deze samenvatting voor €8,35. Je zit daarna nergens aan vast.