ARMS
Lecture 01
Frequentist framework Bayesian framework
Still mainstream (but Bayes is catching up). Based Increased attention since the so-called replication
on the null hypothesis, p-values, confidence crisis (increased criticisms against the null
intervals, effect sizes, power analysis. hypothesis test: mistakes, incorrect interpretations
of test results, p-hacking, over-emphasis on
significance, underpowered studies, publication
bias).
In the frequentist approach all relevant In the Bayesian approach, in addition to the
information for inference is contained in the likelihood function to capture the information in
likelihood function. the data, we may also have prior information
about 𝜇 (mean). The central idea/mechanism is
that prior knowledge is updated with information
in the data, which together provides posterior
distribution for 𝜇.
- Advantage: accumulating knowledge
(“today’s posterior is tomorrow’s prior”)
- Disadvantage: results depend on choice of
prior
Frequentist 95% confidence interval (CI): if we Bayesian 95% credible interval: there is 95%
were to repeat this experiment many times and probability that the true value is in the credible
calculate a CI each time, 95% of the intervals will interval.
include the true parameter value (and 5% does
not).
Probability is relative frequency. Probability is degree of belief.
Evaluating the model: Evaluating the model:
- Estimate parameters of model - Estimate parameters of model
- Test with NHST if parameters are - Compare support in data for different
2
significantly non-zero, e.g., 𝐻0 : 𝑅 = 0 models/hypotheses using Bayes factor
2
versus 𝐻0 : 𝑅 > 0
Exploration or theory evaluation: Exploration or theory evaluation:
- Method enter – data analist decides what - As implemented in JASP-base, somewhat
goes on in the model exploratory
- Method stepwise (forward/backward) – the - BAIN can evaluate informative hypotheses,
best prediction model is determined based which are confirmative
on results in this sample
Which model is confirmatory and which
exploratory? Which method capitalizes most on
chance? Which method has best chance to get
replicated?
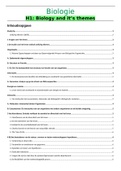
Empirical research uses collected data to learn from. Information in this data is captured in a likelihood
function. Example: parameter of interest is a mean. We assume a normal likelihood function, where the x-
axis contains the values for a mean and the y-axis contains the likelihood of each value for the mean and
the observed data.
1
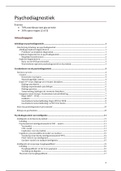
,There are estimating IQs with five priors:
o First one: every value is equally likely (I just want to learn from my data).
o Second one: more specific, an average IQ will be between two limits/bounds; prior with bounds
(still want to learn from my data).
o Third one: normal distribution, rather fake.
o Four and five: very specific; trust your prior knowledge; very informative.
Each prior provides unique posterior. You can choose an uninformative prior without adding additional
knowledge. When we add some prior information, the posterior is more peaked. Combining data and prior,
you get posterior and are more certain than when you didn’t add this value information.
The posterior distribution of the parameter(s) of interest provides all desired estimates:
Posterior Mean or Mode Posterior SD Posterior 95% Credible Interval
The mean or mode of the Standard deviation of posterior Providing the bounds of the part
posterior distribution. distribution (comparable to of the posterior in which 95% of
frequentist standard error). the posterior mass is.
If we know what the posterior distribution looks like (the shape of it), you also have all the summary
measures of the distributions you’re interested in. How big the distribution is, tells you about the certainty.
Results (and conclusions) depend on things not observed and on the sampling plan. Same data can give
different results. This is not the case in the Bayesian world, but there are other problems there. The
Bayesian solution is Bayes conditions on observed data, whereas frequentist testing conditions on the null
hypothesis. Pr(Hj|data) = probability that hypothesis Hj is supported by the data. Pr(data|H0) = p-value, the
probability of observing same or more extreme data given that the null is true.
Researchers with hypotheses may prefer to get information on the probability that their hypotheses are
true. Or, stated differently, to what extent does the data support their hypotheses? Posterior model
probability (PMP) = the (Bayesian) probability of the hypothesis after observing the data. Bayesian
probability of a hypothesis being true depends on two criteria: (1) how sensible it is, based on current
knowledge (the prior) and (2) how well it fits new data (the evidence). Furthermore, Bayesian testing is
comparative – hypotheses are tested against one another, not in isolation. This is also seen in the Bayes
factor:
2
,𝐵𝐹10 = 10 means support for 𝐻1 is 10 times stronger than for 𝐻0 . 𝐵𝐹10 = 1 means support for 𝐻1 is as
strong as support for 𝐻0 . Posterior probabilities of hypotheses (PMP) are also relative probabilities. PMPs
are an update of prior probabilities for hypotheses with the Bayes factor.
Both frameworks use probability theory. This leads to debate (same word used for different things) and to
differences in the correct interpretation of statistical results. E.g., p-value as PMP, also the 95% intervals.
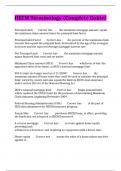
Linear regression – scatterplot for scores on the variables x and y on the linear positive association
between them. The sum of the squared residuals has to be as small as possible.
Blue line = predicted outcome (plus intercept).
Multiple linear regression model – observed outcome is prediction based on the model and some error in
prediction (additive linear model).
Residuals are approximately normally distributed. Mean zero and certain residual variance.
All results are only reliable if assumptions made by the model and approach roughly hold.
➢ Serious violations lead to incorrect results.
➢ Sometimes there are easy solutions (e.g., deleting a severe outlier, or adding a quadratic term) and
sometimes not.
➢ Per model, know what the assumptions are and always check them carefully.
R-squared is the percentage for the sample, which is basically the biased number of the true R in the
population. The adjusted R-squared is the percentage in the total population. How much larger it is,
depends on the number of predictors (the more, the larger). There is always the risk of overfitting.
Taking the scale of the predictors into account: unstandardized in the model (B in the formula). If you look
at the standardized B, we transform it to a standard of 1. Here you can see which predictor has more
importance on the variable (the size). The higher the beta, the more the influence.
3
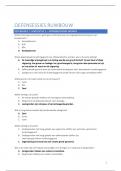
, Bayesian estimates are a summary of posterior distributions of parameters (B). Differences with the
frequentist results can be explained by impact of prior. BF inclusion evaluates if the model improves with
this predictor. The last column provides 95% credible interval for each regression coefficient. Bivariate
relation ≠ unique effect.
Workgroup 01
Term Definition A Situation That Benefits
Reliability (when The extent to which a measurement When you obtain the same results from
measuring a construct) is free from random measurement a group with independent
errors. This means that the scores measurements, at different times, with
are independent of time, place, and the same measurement tool.
environment.
Construct Validity The extent to which the instrument In the case of a questionnaire on a
(operationalization) succeeds in sensitive subject, the questions are
measuring the construct and thus formulated in such a way as to limit the
fits the conceptual definition; how tendency to answer socially desirable;
well a test measures the concept it it provides both convergent and
was designed to evaluate. divergent evidence with multiple
methods of measurement.
Internal Validity The extent to which the research You carry out an experiment in which
method can eliminate alternative everything (except the dependent
explanations for an variable) is controlled.
effect/relationship; the extent to
which the observed results
represent the truth in the
population we are observing and,
thus, are not due to methodological
errors.
External Validity The extent to which the results of a The sample is representative of the
study are generalizable to other population; the findings can be
populations, settings, and times. generalizable to similar individuals or
populations.
Statistical Validity The extent to which the results of a A researcher uses a certain data
statistical analysis are accurate and analysis technique only after he has
well-founded. checked whether the corresponding
conditions/assumptions have been
met.
To be able to demonstrate a causal relationship:
1) Two or more variables should be related (covariation).
2) The cause should precede the outcome (in time; temporal precedence).
3) No other explanations may be possible.
Analysis Question
Descriptive Analyses (range, mean, standard What are the measures of central tendency (mean)
deviation) and dispersion (range and standard deviation) for
key variables of the study?
Pearson’s Correlations What are the simple relationships between key
variables of the study?
Independent Samples t-test Are there differences in variable X and variable Y?
4
Lecture 01
Frequentist framework Bayesian framework
Still mainstream (but Bayes is catching up). Based Increased attention since the so-called replication
on the null hypothesis, p-values, confidence crisis (increased criticisms against the null
intervals, effect sizes, power analysis. hypothesis test: mistakes, incorrect interpretations
of test results, p-hacking, over-emphasis on
significance, underpowered studies, publication
bias).
In the frequentist approach all relevant In the Bayesian approach, in addition to the
information for inference is contained in the likelihood function to capture the information in
likelihood function. the data, we may also have prior information
about 𝜇 (mean). The central idea/mechanism is
that prior knowledge is updated with information
in the data, which together provides posterior
distribution for 𝜇.
- Advantage: accumulating knowledge
(“today’s posterior is tomorrow’s prior”)
- Disadvantage: results depend on choice of
prior
Frequentist 95% confidence interval (CI): if we Bayesian 95% credible interval: there is 95%
were to repeat this experiment many times and probability that the true value is in the credible
calculate a CI each time, 95% of the intervals will interval.
include the true parameter value (and 5% does
not).
Probability is relative frequency. Probability is degree of belief.
Evaluating the model: Evaluating the model:
- Estimate parameters of model - Estimate parameters of model
- Test with NHST if parameters are - Compare support in data for different
2
significantly non-zero, e.g., 𝐻0 : 𝑅 = 0 models/hypotheses using Bayes factor
2
versus 𝐻0 : 𝑅 > 0
Exploration or theory evaluation: Exploration or theory evaluation:
- Method enter – data analist decides what - As implemented in JASP-base, somewhat
goes on in the model exploratory
- Method stepwise (forward/backward) – the - BAIN can evaluate informative hypotheses,
best prediction model is determined based which are confirmative
on results in this sample
Which model is confirmatory and which
exploratory? Which method capitalizes most on
chance? Which method has best chance to get
replicated?
Empirical research uses collected data to learn from. Information in this data is captured in a likelihood
function. Example: parameter of interest is a mean. We assume a normal likelihood function, where the x-
axis contains the values for a mean and the y-axis contains the likelihood of each value for the mean and
the observed data.
1
,There are estimating IQs with five priors:
o First one: every value is equally likely (I just want to learn from my data).
o Second one: more specific, an average IQ will be between two limits/bounds; prior with bounds
(still want to learn from my data).
o Third one: normal distribution, rather fake.
o Four and five: very specific; trust your prior knowledge; very informative.
Each prior provides unique posterior. You can choose an uninformative prior without adding additional
knowledge. When we add some prior information, the posterior is more peaked. Combining data and prior,
you get posterior and are more certain than when you didn’t add this value information.
The posterior distribution of the parameter(s) of interest provides all desired estimates:
Posterior Mean or Mode Posterior SD Posterior 95% Credible Interval
The mean or mode of the Standard deviation of posterior Providing the bounds of the part
posterior distribution. distribution (comparable to of the posterior in which 95% of
frequentist standard error). the posterior mass is.
If we know what the posterior distribution looks like (the shape of it), you also have all the summary
measures of the distributions you’re interested in. How big the distribution is, tells you about the certainty.
Results (and conclusions) depend on things not observed and on the sampling plan. Same data can give
different results. This is not the case in the Bayesian world, but there are other problems there. The
Bayesian solution is Bayes conditions on observed data, whereas frequentist testing conditions on the null
hypothesis. Pr(Hj|data) = probability that hypothesis Hj is supported by the data. Pr(data|H0) = p-value, the
probability of observing same or more extreme data given that the null is true.
Researchers with hypotheses may prefer to get information on the probability that their hypotheses are
true. Or, stated differently, to what extent does the data support their hypotheses? Posterior model
probability (PMP) = the (Bayesian) probability of the hypothesis after observing the data. Bayesian
probability of a hypothesis being true depends on two criteria: (1) how sensible it is, based on current
knowledge (the prior) and (2) how well it fits new data (the evidence). Furthermore, Bayesian testing is
comparative – hypotheses are tested against one another, not in isolation. This is also seen in the Bayes
factor:
2
,𝐵𝐹10 = 10 means support for 𝐻1 is 10 times stronger than for 𝐻0 . 𝐵𝐹10 = 1 means support for 𝐻1 is as
strong as support for 𝐻0 . Posterior probabilities of hypotheses (PMP) are also relative probabilities. PMPs
are an update of prior probabilities for hypotheses with the Bayes factor.
Both frameworks use probability theory. This leads to debate (same word used for different things) and to
differences in the correct interpretation of statistical results. E.g., p-value as PMP, also the 95% intervals.
Linear regression – scatterplot for scores on the variables x and y on the linear positive association
between them. The sum of the squared residuals has to be as small as possible.
Blue line = predicted outcome (plus intercept).
Multiple linear regression model – observed outcome is prediction based on the model and some error in
prediction (additive linear model).
Residuals are approximately normally distributed. Mean zero and certain residual variance.
All results are only reliable if assumptions made by the model and approach roughly hold.
➢ Serious violations lead to incorrect results.
➢ Sometimes there are easy solutions (e.g., deleting a severe outlier, or adding a quadratic term) and
sometimes not.
➢ Per model, know what the assumptions are and always check them carefully.
R-squared is the percentage for the sample, which is basically the biased number of the true R in the
population. The adjusted R-squared is the percentage in the total population. How much larger it is,
depends on the number of predictors (the more, the larger). There is always the risk of overfitting.
Taking the scale of the predictors into account: unstandardized in the model (B in the formula). If you look
at the standardized B, we transform it to a standard of 1. Here you can see which predictor has more
importance on the variable (the size). The higher the beta, the more the influence.
3
, Bayesian estimates are a summary of posterior distributions of parameters (B). Differences with the
frequentist results can be explained by impact of prior. BF inclusion evaluates if the model improves with
this predictor. The last column provides 95% credible interval for each regression coefficient. Bivariate
relation ≠ unique effect.
Workgroup 01
Term Definition A Situation That Benefits
Reliability (when The extent to which a measurement When you obtain the same results from
measuring a construct) is free from random measurement a group with independent
errors. This means that the scores measurements, at different times, with
are independent of time, place, and the same measurement tool.
environment.
Construct Validity The extent to which the instrument In the case of a questionnaire on a
(operationalization) succeeds in sensitive subject, the questions are
measuring the construct and thus formulated in such a way as to limit the
fits the conceptual definition; how tendency to answer socially desirable;
well a test measures the concept it it provides both convergent and
was designed to evaluate. divergent evidence with multiple
methods of measurement.
Internal Validity The extent to which the research You carry out an experiment in which
method can eliminate alternative everything (except the dependent
explanations for an variable) is controlled.
effect/relationship; the extent to
which the observed results
represent the truth in the
population we are observing and,
thus, are not due to methodological
errors.
External Validity The extent to which the results of a The sample is representative of the
study are generalizable to other population; the findings can be
populations, settings, and times. generalizable to similar individuals or
populations.
Statistical Validity The extent to which the results of a A researcher uses a certain data
statistical analysis are accurate and analysis technique only after he has
well-founded. checked whether the corresponding
conditions/assumptions have been
met.
To be able to demonstrate a causal relationship:
1) Two or more variables should be related (covariation).
2) The cause should precede the outcome (in time; temporal precedence).
3) No other explanations may be possible.
Analysis Question
Descriptive Analyses (range, mean, standard What are the measures of central tendency (mean)
deviation) and dispersion (range and standard deviation) for
key variables of the study?
Pearson’s Correlations What are the simple relationships between key
variables of the study?
Independent Samples t-test Are there differences in variable X and variable Y?
4