100% tevredenheidsgarantie Direct beschikbaar na betaling Zowel online als in PDF Je zit nergens aan vast
logo-home
Class notes Maths €8,95   In winkelwagen

College aantekeningen

Class notes Maths

 8 keer bekeken  0 keer verkocht
  • Vak
  • Instelling

Regression analysis is a statistical method used to find the relationship between two or more variables. It helps us to understand how the value of one variable changes when there is a change in another variable. The regression line is a line that represents the relationship between two variables, ...

[Meer zien]
Voorbeeld 1 van de 1  pagina's

  • 15 april 2023
  • 1
  • 2022/2023
  • College aantekeningen
  • Rya
  • Alle colleges
avatar-seller
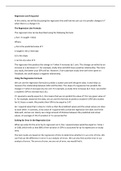
Regression and R Squared

In this article, we will be discussing the regression line and how we can use it to predict changes in Y
when there is a change in X.

The Regression Line Formula

The regression line can be described using the following formula:

y hat = b naught + b1(x)

Where:

y hat is the predicted value of Y

b naught is the y-intercept

b1 is the slope

x can be any value of X
The regression line predicts the change in Y when X increases by 1 unit. This change can either be an
increase or a decrease in Y. For example, study time and GPA have a positive relationship. The more
you study, the better your GPA will be. However, if we substitute study time with time spent on
Facebook, we could expect a negative relationship.

Using the Regression Formula

We can use the regression formula to predict a scatter plot with the given data. It also helps us
measure the relationship between GPA and the data. The slope of a regression line predicts the
change in Y when X increases by one unit. For example, as study time increases by 1 hour, we predict
a student's GPA to increase by 0.311.

If r squared is exactly equal to 1, this means that we can predict the value of Y for any given value of
X. For example, based on this data, we can use this formula to predict a student's GPA who studies
for 6.5 hours a week. We predict their GPA to be equal to 3.47.

An r squared value that is close to 1 tells us that the predicted values and the actual values are close
to each other. In contrast, a low value of r squared tells us that the regression line does not fit the
data well, and we can clearly see a large amount of distance between the predicted and actual
values. An average of 1% of variation in Y is accounted for.

Solving for Error in the Regression Line

When we solve for the error by its regression on X, the r-squared value would be equal to r times r
or 0.88, which tells us that 88% of the variation in GPA is accounted for by its regressions on study
time.
The test results are based on the regression of time to determine whether it is an error of time. We
can find out the difference in error in our analysis of errors. We can also find out the error in our
analysis of errors. The errors of error, we are not of error; we would find it.

Voordelen van het kopen van samenvattingen bij Stuvia op een rij:

Verzekerd van kwaliteit door reviews

Verzekerd van kwaliteit door reviews

Stuvia-klanten hebben meer dan 700.000 samenvattingen beoordeeld. Zo weet je zeker dat je de beste documenten koopt!

Snel en makkelijk kopen

Snel en makkelijk kopen

Je betaalt supersnel en eenmalig met iDeal, creditcard of Stuvia-tegoed voor de samenvatting. Zonder lidmaatschap.

Focus op de essentie

Focus op de essentie

Samenvattingen worden geschreven voor en door anderen. Daarom zijn de samenvattingen altijd betrouwbaar en actueel. Zo kom je snel tot de kern!

Veelgestelde vragen

Wat krijg ik als ik dit document koop?

Je krijgt een PDF, die direct beschikbaar is na je aankoop. Het gekochte document is altijd, overal en oneindig toegankelijk via je profiel.

Tevredenheidsgarantie: hoe werkt dat?

Onze tevredenheidsgarantie zorgt ervoor dat je altijd een studiedocument vindt dat goed bij je past. Je vult een formulier in en onze klantenservice regelt de rest.

Van wie koop ik deze samenvatting?

Stuvia is een marktplaats, je koop dit document dus niet van ons, maar van verkoper kanikathakur. Stuvia faciliteert de betaling aan de verkoper.

Zit ik meteen vast aan een abonnement?

Nee, je koopt alleen deze samenvatting voor €8,95. Je zit daarna nergens aan vast.

Is Stuvia te vertrouwen?

4,6 sterren op Google & Trustpilot (+1000 reviews)

Afgelopen 30 dagen zijn er 83637 samenvattingen verkocht

Opgericht in 2010, al 14 jaar dé plek om samenvattingen te kopen

Start met verkopen
€8,95
  • (0)
  Kopen