100% tevredenheidsgarantie Direct beschikbaar na je betaling Lees online óf als PDF Geen vaste maandelijkse kosten
logo-home
Summary Statistics ALL weeks 1-7 summaries €7,99
In winkelwagen

Samenvatting

Summary Statistics ALL weeks 1-7 summaries

 6 keer verkocht

The file contains all summaries from the Statistics course from weeks 1-7. The information is taken from the lecture slides and the book. These summaries help studying for the exam.

Voorbeeld 2 van de 14  pagina's

  • 23 mei 2023
  • 14
  • 2022/2023
  • Samenvatting
Alle documenten voor dit vak (7)
avatar-seller
enk
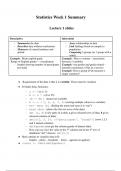
Statistics Week 1 Summary

Lecture 1 slides

Descriptive Inferential
- Summarise the data - Asses relationships in data
- Describes data without conclusions - Link findings based on sample to
- Measures of central tendency and population
spread - Comparing 2 groups (or 1 group with a
value)
Example: Mean english grade Example: Men vs women – association
Range of English grades -> visualisation between 2 variables
- barplot showing number of participants Example: Are gender and grade related –
per study internal (consistency of Qs in a survey)
Example: Does a group of Qs measure a
single construct?


● Requirement of the data is that it is variable. There must be variation
● R Studio basic functions:
- a <- 5 (a is 5)
- b <- a * a (b is 25)
- (d <- NA ) means not available
- b <- c ( 2, 4, 6, 7, 8) (storing multiple values in a variable)
- mn<- mean (b) (finding the mean and store it in “mn”)
- head (dat) (shows the first six rows of the data)
- dat [a, b] (view parts of a table, a gives selected rows of data, b gives
selected columns of data)
- dat[c(1, 3, 5), c(“participant”, “study”)] (rows 1,3,5
and 2 named columns)
- dat$gender (you get the column gender of dataset data)
- How can you view the value in the 3rd column and in the 4th row of
dataframe ‘dat’? Answer: dat[4,3]
● Basic options to visualise data in R:
- barplot - plot() - boxplot() - hist() - qqnorm en qqline()
● (count <- table(dat$gender))

, - first create frequency table, then display: barplot(counts)
● Descriptive statistics: Central tendency:
- mean(dat$english_score) (mean of all people for English score)
- median(dat$english_score)
- mean(dat[dat$gender==”F”, ]$english_score (mean of
women for English score)
● Descriptive statistics: Spread:
- min(dat$en_score) #min value
- max(dat$en_score) #max value
- var(dat$en_score) #variance : average squared deviation from mean
- sd(dat$en_score) #squared root of variance (standard deviation)
● Descriptive statistics: frequency tables:
- table(dat$gender)
- table(dat$study)
- table(dat\$gender, dat\($study) # a cross table of study and
gender
- table(dat$gender, dat$study)
● Inferential statistics:
- t.test() #single, sample, paired, independent
- wilcox.test() #for non-parametric alternatives to the t-test (Mann
Whitney U test, Wilcoxon signed-rank test)
- binom.test() #sign test
- chisq.test() #x2 -> chi-square test
- cor.test() #correlation
- alpha() #from package psych (for Cronbach’s α)
● Examples (t.test & correlation):
- t.test(english_grade ~ bl_edu, data=dat) #assessing
average group differences for a numerical variable
- cor(dat$english_score, dat$english_grade)#assessing
strength of the relationship between two numerical variables

Dit zijn jouw voordelen als je samenvattingen koopt bij Stuvia:

Bewezen kwaliteit door reviews

Bewezen kwaliteit door reviews

Studenten hebben al meer dan 850.000 samenvattingen beoordeeld. Zo weet jij zeker dat je de beste keuze maakt!

In een paar klikken geregeld

In een paar klikken geregeld

Geen gedoe — betaal gewoon eenmalig met iDeal, creditcard of je Stuvia-tegoed en je bent klaar. Geen abonnement nodig.

Direct to-the-point

Direct to-the-point

Studenten maken samenvattingen voor studenten. Dat betekent: actuele inhoud waar jij écht wat aan hebt. Geen overbodige details!

Veelgestelde vragen

Wat krijg ik als ik dit document koop?

Je krijgt een PDF, die direct beschikbaar is na je aankoop. Het gekochte document is altijd, overal en oneindig toegankelijk via je profiel.

Tevredenheidsgarantie: hoe werkt dat?

Onze tevredenheidsgarantie zorgt ervoor dat je altijd een studiedocument vindt dat goed bij je past. Je vult een formulier in en onze klantenservice regelt de rest.

Van wie koop ik deze samenvatting?

Stuvia is een marktplaats, je koop dit document dus niet van ons, maar van verkoper enk. Stuvia faciliteert de betaling aan de verkoper.

Zit ik meteen vast aan een abonnement?

Nee, je koopt alleen deze samenvatting voor €7,99. Je zit daarna nergens aan vast.

Is Stuvia te vertrouwen?

4,6 sterren op Google & Trustpilot (+1000 reviews)

Afgelopen 30 dagen zijn er 68175 samenvattingen verkocht

Opgericht in 2010, al 15 jaar dé plek om samenvattingen te kopen

Begin nu gratis
€7,99  6x  verkocht
  • (0)
In winkelwagen
Toegevoegd