100% tevredenheidsgarantie Direct beschikbaar na je betaling Lees online óf als PDF Geen vaste maandelijkse kosten
logo-home
Complete Solution Manual Fundamentals of Biostatistics 8th Edition Rosner Questions & Answers with rationales €16,67
In winkelwagen

Tentamen (uitwerkingen)

Complete Solution Manual Fundamentals of Biostatistics 8th Edition Rosner Questions & Answers with rationales

3 beoordelingen
 14 keer verkocht
  • Vak
  • Fundamentals
  • Instelling
  • Fundamentals
  • Boek

Fundamentals of Biostatistics 8th Edition Rosner Solutions Manual Complete Solution Manual Fundamentals of Biostatistics 8th Edition Rosner Questions & Answers with rationales PDF File All Pages All Chapters Grade A+

Voorbeeld 4 van de 453  pagina's

  • 18 juni 2023
  • 453
  • 2022/2023
  • Tentamen (uitwerkingen)
  • Vragen en antwoorden
  • Fundamentals
  • Fundamentals

3  beoordelingen

review-writer-avatar

Door: pedeclerck • 2 maanden geleden

review-writer-avatar

Door: abirbenhassen • 3 maanden geleden

review-writer-avatar

Door: vivekramawoothar2 • 9 maanden geleden

reply-writer-avatar

Door: gradexam • 9 maanden geleden

We sincerely appreciate your outstanding 5-star review of this document. Your feedback means a great deal to us!

avatar-seller
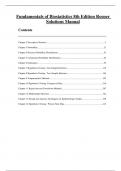
Fundamentals of Biostatistics 8th Edition Rosner
Solutions Manual
Contents


Chapter 2 Descriptive Statistics........................................................................................................2

Chapter 3 Probability...................................................................................................................... 21

Chapter 4 Discrete Probability Distributions.................................................................................. 43

Chapter 5 Continuous Probability Distributions ............................................................................ 65

Chapter 6 Estimation ...................................................................................................................... 93

Chapter 7 Hypothesis Testing: One-Sample Inference ............................................................... 119

Chapter 8 Hypothesis Testing: Two-Sample Inference ............................................................... 146

Chapter 9 Nonparametric Methods .............................................................................................. 192

Chapter 10 Hypothesis Testing: Categorical Data ....................................................................... 216

Chapter 11 Regression and Correlation Methods ......................................................................... 267

Chapter 12 Multisample Inference ............................................................................................... 322

Chapter 13 Design and Analysis Techniques for Epidemiologic Studies ....................................358

Chapter 14 Hypothesis Testing: Person-Time Data ....................................................................413

, DESCRIPTIVE
STATISTICS
20.1 We have

x=
 xi = 215 = 8.6 days
n 25
(n + 1)
median = th largest observation = 13th largest observation = 8 days
2

20.2 We have that
25

(x − x)
2
i
( 5 − 8.6)2 + + ( 4 − 8.6)2 =
784
= 32.67
s2 = i=1 =
24 24 24

s = standard deviation = variance = 5.72 days
range = largest − smallest observation = 30 − 3 = 27 days

20.3 Suppose we divide the patients according to whether or not they received antibiotics, and calculate the
mean and standard deviation for each of the two subsamples:


x s n

Antibiotics 11.57 8.81 7

No antibiotics 7.44 3.70 18

Antibiotics - x7 8.50 3.73 6

It appears that antibiotic users stay longer in the hospital. Note that when we remove observation 7, the
two standard deviations are in substantial agreement, and the difference in the means is not that
impressive anymore. This example shows that x and s2 are not robust; that is, their values are easily
affected by outliers, particularly in small samples. Therefore, we would not conclude that hospital stay is
different for antibiotic users vs. non-antibiotic users.


2

,CHAPTER 2/DESCRIPTIVE STATISTICS 3


2.4-2.7 Changing the scale by a factor c will multiply each data value xi by c, changing it to cxi . Again the same
individual’s value will be at the median and the same individual’s value will be at the mode, but these
values will be multiplied by c. The geometric mean will be multiplied by c also, as can easily be shown:

Geometric mean = [(cx1)(cx2 ) (cxn )]1/n
= (cn x1  x2 xn )1/n
= c( x1  x2 xn )1/n
= c  old geometric mean

The range will also be multiplied by c.
For example, if c = 2 we have:

xi

Original Scale
–3 –2 –1 0 1 2 3
xi

Scale 2
–6 –4 –2 0 2 4 6

2.8 We first read the data file “running time” in R
> require(xlsx)
> running<-na.omit(read.xlsx("C:/Data_sets/running_time.xlsx",1,
header=TRUE))

Let us print the first observations
> head(running)
week time
1 1 12.80
2 2 12.20
3 3 12.25
4 4 12.18
5 5 11.53
6 6 12.47

The mean 1-mile running time over 18 weeks is equal to 12.09 minutes:
> mean(running$time)
[1] 12.08889

2.9 The standard deviation is given by
> sd(running$time)
[1] 0.3874181

2.10 Let us first create the variable “time_100” and then calculate its mean and standard deviation
> running$time_100=100*running$time
> mean(running$time_100)
[1] 1208.889

> sd(running$time_100)
[1] 38.74181

2.11 Let us to construct the stem-and-leaf plot in R using the stem.leaf command from the package “aplpack”
> require(aplpack)

, CHAPTER 2/DESCRIPTIVE STATISTICS 4


> stem.leaf(running$time_100, unit=1, trim.outliers=FALSE)

1 | 2: represents 12
leaf unit: 1
n: 18
2 115 | 37
3 116 | 7
5 117 | 23
7 118 | 03
8 119 | 2
(1) 120 | 8
9 121 | 8
8 122 | 05
6 123 | 03
4 124 | 7
3 125 | 5
2 126 | 7
127 |
1 128 | 0

Note: one can also use the standard command stem (which does require the “aplpack” package) to get a similar plot
> stem(running$time_100, scale = 4)
Box plot of running times

2.12 The quantiles of the running times are
12.8


> quantile(running$time) 12.6
0% 25% 50% 75% 100%
11.5300 11.7475 12.1300 12.3225 12.8000 12.4


An outlying value is identify has any value x such that
x  upper quartile+1.5  (upper quartile-lower quartile)
Time


12.2


= 12.32 +1.5  (12.32 −11.75) 12.0

= 12.32 + 0.85 = 13.17
11.8


Since 12.97 minutes is smaller than the largest nonoutlying value
(13.17 minutes), this running time recorded in his first week of 11.6


running in the spring is not an outlying value relative to the
distribution of running times recorded the previous year.

2.13 The mean is

x=
 xi = 469 = 19.54 mg dL
24 24

2.14 We have that
24

(x − x )
i
2

(49 −19.54)2 + + (12 −19.54)
2
6495.96
s2 = i=1
= = = 282.43
23 23 23
s = 282.43 = 16.81 mg/dL

2.15 We provide two rows for each stem corresponding to leaves 5-9 and 0-4 respectively. We have

Dit zijn jouw voordelen als je samenvattingen koopt bij Stuvia:

Bewezen kwaliteit door reviews

Bewezen kwaliteit door reviews

Studenten hebben al meer dan 850.000 samenvattingen beoordeeld. Zo weet jij zeker dat je de beste keuze maakt!

In een paar klikken geregeld

In een paar klikken geregeld

Geen gedoe — betaal gewoon eenmalig met iDeal, creditcard of je Stuvia-tegoed en je bent klaar. Geen abonnement nodig.

Direct to-the-point

Direct to-the-point

Studenten maken samenvattingen voor studenten. Dat betekent: actuele inhoud waar jij écht wat aan hebt. Geen overbodige details!

Veelgestelde vragen

Wat krijg ik als ik dit document koop?

Je krijgt een PDF, die direct beschikbaar is na je aankoop. Het gekochte document is altijd, overal en oneindig toegankelijk via je profiel.

Tevredenheidsgarantie: hoe werkt dat?

Onze tevredenheidsgarantie zorgt ervoor dat je altijd een studiedocument vindt dat goed bij je past. Je vult een formulier in en onze klantenservice regelt de rest.

Van wie koop ik deze samenvatting?

Stuvia is een marktplaats, je koop dit document dus niet van ons, maar van verkoper gradexam. Stuvia faciliteert de betaling aan de verkoper.

Zit ik meteen vast aan een abonnement?

Nee, je koopt alleen deze samenvatting voor €16,67. Je zit daarna nergens aan vast.

Is Stuvia te vertrouwen?

4,6 sterren op Google & Trustpilot (+1000 reviews)

Afgelopen 30 dagen zijn er 68175 samenvattingen verkocht

Opgericht in 2010, al 15 jaar dé plek om samenvattingen te kopen

Begin nu gratis
€16,67  14x  verkocht
  • (3)
In winkelwagen
Toegevoegd