100% tevredenheidsgarantie Direct beschikbaar na je betaling Lees online óf als PDF Geen vaste maandelijkse kosten
logo-home
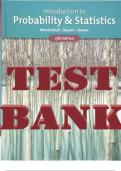
TEST BANK for Introduction to Probability and Statistics by Mendenhall, Beaver & Barbara Beaver | All 15 Chapters €29,99
In winkelwagen

Tentamen (uitwerkingen)

TEST BANK for Introduction to Probability and Statistics by Mendenhall, Beaver & Barbara Beaver | All 15 Chapters

 3 keer verkocht
  • Vak
  • Introduction to Probability and Statistics
  • Instelling
  • Introduction To Probability And Statistics
  • Boek

TEST BANK for Introduction to Probability and Statistics by William Mendenhall, Robert Beaver & Barbara M Beaver. (Complete 15 Chapters)

Voorbeeld 4 van de 965  pagina's

  • 22 juli 2023
  • 965
  • 2022/2023
  • Tentamen (uitwerkingen)
  • Vragen en antwoorden
  • Introduction to Probability and Statistics
  • Introduction to Probability and Statistics
avatar-seller
,Chapter 01 - Describing Data with Graphs

1. A variable is a characteristic that changes or varies over time, and/or for different individuals or objects under
consideration. An experimental unit is the individual or object on which a variable is measured.
a. True
b. False
ANSWER: True
POINTS: 1
QUESTION TYPE: True / False
HAS VARIABLES: False
DATE CREATED: 2/4/2019 3:06 AM
DATE MODIFIED: 2/4/2019 3:06 AM

2. Bar and pie charts are graphical techniques for qualitative data. The former focus the attention on the
frequency of the occurrences of the categories, and the later emphasize the percentage of occurrences of each
category.
a. True
b. False
ANSWER: True
POINTS: 1
QUESTION TYPE: True / False
HAS VARIABLES: False
DATE CREATED: 2/4/2019 3:06 AM
DATE MODIFIED: 2/4/2019 3:06 AM

3. In a sample of 1000 students in a university, 125 of them or 12.5% are biology majors. The 12.5% is an
example of statistical inference.
a. True
b. False
ANSWER: False
POINTS: 1
QUESTION TYPE: True / False
HAS VARIABLES: False
DATE CREATED: 2/4/2019 3:06 AM
DATE MODIFIED: 2/4/2019 3:06 AM

4. Individual observations within each class may be found in a frequency distribution.
a. True
b. False
ANSWER: False
POINTS: 1
QUESTION TYPE: True / False
HAS VARIABLES: False
DATE CREATED: 2/4/2019 3:06 AM
DATE MODIFIED: 2/4/2019 3:06 AM

5. Twenty-five percent of a sample of 200 professional tennis players indicated that their parents did not play

,Chapter 01 - Describing Data with Graphs

tennis. This is an example of descriptive statistics as opposed to inferential statistics.
a. True
b. False
ANSWER: True
POINTS: 1
QUESTION TYPE: True / False
HAS VARIABLES: False
DATE CREATED: 2/4/2019 3:06 AM
DATE MODIFIED: 2/4/2019 3:06 AM

6. A local cable system using a sample of 1000 subscribers estimates that fifty percent of its subscribers watch
premium channel at least five times per week. This is an example of inferential statistics as opposed to
descriptive statistics.
a. True
b. False
ANSWER: True
POINTS: 1
QUESTION TYPE: True / False
HAS VARIABLES: False
DATE CREATED: 2/4/2019 3:06 AM
DATE MODIFIED: 2/4/2019 3:06 AM

7. Statistical inference is the process of making an estimate, prediction, or decision about a population based on
sample data.
a. True
b. False
ANSWER: True
POINTS: 1
QUESTION TYPE: True / False
HAS VARIABLES: False
DATE CREATED: 2/4/2019 3:06 AM
DATE MODIFIED: 2/4/2019 3:06 AM

8. In the term "frequency distribution," frequency refers to the number of data values or measurements falling
within each class.
a. True
b. False
ANSWER: True
POINTS: 1
QUESTION TYPE: True / False
HAS VARIABLES: False
DATE CREATED: 2/4/2019 3:06 AM
DATE MODIFIED: 2/4/2019 3:06 AM

9. A branch of the statistics discipline that is used to develop and utilize techniques for effectively presenting

, Chapter 01 - Describing Data with Graphs

numerical information is called inferential statistics.
a. True
b. False
ANSWER: False
POINTS: 1
QUESTION TYPE: True / False
HAS VARIABLES: False
DATE CREATED: 2/4/2019 3:06 AM
DATE MODIFIED: 2/4/2019 3:06 AM

10. A branch of the statistics discipline that is used to develop and utilize techniques for properly making
inferences about population characteristics from information contained in a sample drawn from this population
is called inferential statistics.
a. True
b. False
ANSWER: True
POINTS: 1
QUESTION TYPE: True / False
HAS VARIABLES: False
DATE CREATED: 2/4/2019 3:06 AM
DATE MODIFIED: 2/4/2019 3:06 AM

11. Persons or objects that have characteristics of interest to statisticians are called variables.
a. True
b. False
ANSWER: False
POINTS: 1
QUESTION TYPE: True / False
HAS VARIABLES: False
DATE CREATED: 2/4/2019 3:06 AM
DATE MODIFIED: 2/4/2019 3:06 AM

12. A qualitative variable about which observations can be made in only two categories is a bivariate data set.
a. True
b. False
ANSWER: False
POINTS: 1
QUESTION TYPE: True / False
HAS VARIABLES: False
DATE CREATED: 2/4/2019 3:06 AM
DATE MODIFIED: 2/4/2019 3:06 AM

13. A variable that is normally described in words rather than numerically is a qualitative variable.
a. True

Dit zijn jouw voordelen als je samenvattingen koopt bij Stuvia:

Bewezen kwaliteit door reviews

Bewezen kwaliteit door reviews

Studenten hebben al meer dan 850.000 samenvattingen beoordeeld. Zo weet jij zeker dat je de beste keuze maakt!

In een paar klikken geregeld

In een paar klikken geregeld

Geen gedoe — betaal gewoon eenmalig met iDeal, creditcard of je Stuvia-tegoed en je bent klaar. Geen abonnement nodig.

Direct to-the-point

Direct to-the-point

Studenten maken samenvattingen voor studenten. Dat betekent: actuele inhoud waar jij écht wat aan hebt. Geen overbodige details!

Veelgestelde vragen

Wat krijg ik als ik dit document koop?

Je krijgt een PDF, die direct beschikbaar is na je aankoop. Het gekochte document is altijd, overal en oneindig toegankelijk via je profiel.

Tevredenheidsgarantie: hoe werkt dat?

Onze tevredenheidsgarantie zorgt ervoor dat je altijd een studiedocument vindt dat goed bij je past. Je vult een formulier in en onze klantenservice regelt de rest.

Van wie koop ik deze samenvatting?

Stuvia is een marktplaats, je koop dit document dus niet van ons, maar van verkoper AcademiContent. Stuvia faciliteert de betaling aan de verkoper.

Zit ik meteen vast aan een abonnement?

Nee, je koopt alleen deze samenvatting voor €29,99. Je zit daarna nergens aan vast.

Is Stuvia te vertrouwen?

4,6 sterren op Google & Trustpilot (+1000 reviews)

Afgelopen 30 dagen zijn er 68175 samenvattingen verkocht

Opgericht in 2010, al 15 jaar dé plek om samenvattingen te kopen

Begin nu gratis

Laatst bekeken door jou


€29,99  3x  verkocht
  • (0)
In winkelwagen
Toegevoegd