Introduction to empirical methods: linear regression models
1. Introduction: linear regression model
- Empirical analysis
> Use data
Test a theory
Estimate relationship between variables
> First step is to clearly define your research question
Economic model
Intuitive and less formal reasoning (observation & existing scientific evidence)
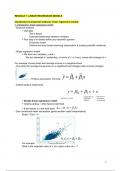
- Single regression model
> We have two variables, y and x
We are interested in ‘explaining y in terms of x’ or ‘how y varies with changes in x’
For example: House prices and average income in a neighbourhood
- How does the average house prices in a neighbourhood changes when income changes
Positive association. Formula:
- Ceteris paribus relationship
> Simple linear regression model:
> Ceteris paribus = other factors held fixed
> If the factors in u are held fixed:
- Zero conditional mean assumption (gives another useful interpretation)
E(u|x) = E(u) = 0
For example:
What is the expected value of y, for a given value of x ^^
1
,Keep asking yourself…
- Can we draw ceteris paribus conclusions about how x affects y in our example?
> We need to assume E(u|x) = E(u) = 0
>> Zero conditional mean assumption
>> What does it mean in our example?
>>> Assume u is the same as amenities
>>> Then, amenities are the same regardless of average income
*E(amenities | income = 10,000) = E(amenities | income = 100,000)
Means: amenities (voorzieningen) is same regardless incomes
* If we think that the amount and quality of amenities is different in
richer than in poorer neighbourhoods then previous assumption
does not hold
* We cannot observe u, so we have no way of knowing whether or not
amenities are the same for all levels of x
2. Estimation and interpretation
- Given graph: each dot is a neighbourhood, positively related
- Estimate by ordinary least square estimates (OLS)
> Select a random sample of the population of interest
Using stata to add the values
> In stata
Income was in 1000 €, when average income increases by 1000, the average
houseprice increases by about 16000 €, ceteris paribus
Output tell us that expected houseprice = equal to -95000 when the income is 0
Does not make sense, cause we do not have negative prices but that is
cause income can not be 0 (> this way good interpretation)
2
,- Multiple regression model
> Difficult to draw ceteris paribus conclusions using simple regression analysis
is 2nd cp? Depends; if error is not correlated
> Multiple regression model:
> Multiple regression analysis allows us to control for many other factors that
simultaneously affect the dependent variable (better predictions also)
3. OLS assumptions for unbiasedness
- Unbiasedness of OLS = Expected value of estimator = population parameter
- Assumptions needed:
MLR1: Linear in parameters
MLR2: Random sampling
MLR3: No perfect collinearity
MLR4: Zero conditional mean, i.e., E(u|x)=0
> Assumption MLR1: Linearity in parameters
> Assumption MLR2: Random sampling
* We have a random sample of size n, following the population model
* If sample is not random, selection bias
> Assumption MLR3: No perfect collinearity = no perfect linear relationships
* In the sample (and therefore in the population):
None of the independent variables is constant, and
There are no exact linear relationships among the independent variables
Example:
3
, Perfect collinearity
- Estimation simply does not work
- Some softwares give error message and no/strange results
- Stata drops one variable automatically/arbitrarily and then estimates a
model that does not suffer from this problem:
But it may not be the variable you would prefer to drop, so i) start by
defining model properly and, only then, ii) estimate it
Imperfect collinearity
- Model works but is problematic, imprecise estimates
- Beware of x’s with high correlation
- Symptoms of imperfect collinearity (for example, between x1 & x2):
Big F-stat (x1, x2 jointly significant) but
small t-statistics (for example x1 and x2 individually insignificant)
> Assumption MLR4: Zero conditional mean (important and complicated)
Next step is to do hypothesis testing: do we need additional assumptions to do inference?
YES:
4. Assumptions for inference (gevolgtrekking/conclusie)
- Inference - hypothesis testing
> We make two additional assumptions:
MLR5: Homoskedasticity
MLR6: Normality
> MLR1 - MLR6: OLS estimator is the minimum variance unbiased estimator
- Assumption MLR5: homoskedasticity
> Variance of error term is the same regardless of the values of the independent
Variables:
> Importance of error term same for all individuals
> Magnitude of uncertainty in the outcome of y is the same at all levels of x’s
Example: in which figure is the homoskedasticy assumption most likely to be satisfied?
B less variation for small x, more for large x
So in figure A the assumption is most likely to be satisfied
> If assumption does not hold, then we have heteroskedasticity:
> In case of heteroskedasticity:
* SE and statistics used for inference can easily be adjusted
→ ALWAYS use heteroskedasticity-robust standard errors
4
Voordelen van het kopen van samenvattingen bij Stuvia op een rij:
Verzekerd van kwaliteit door reviews
Stuvia-klanten hebben meer dan 700.000 samenvattingen beoordeeld. Zo weet je zeker dat je de beste documenten koopt!
Snel en makkelijk kopen
Je betaalt supersnel en eenmalig met iDeal, creditcard of Stuvia-tegoed voor de samenvatting. Zonder lidmaatschap.
Focus op de essentie
Samenvattingen worden geschreven voor en door anderen. Daarom zijn de samenvattingen altijd betrouwbaar en actueel. Zo kom je snel tot de kern!
Veelgestelde vragen
Wat krijg ik als ik dit document koop?
Je krijgt een PDF, die direct beschikbaar is na je aankoop. Het gekochte document is altijd, overal en oneindig toegankelijk via je profiel.
Tevredenheidsgarantie: hoe werkt dat?
Onze tevredenheidsgarantie zorgt ervoor dat je altijd een studiedocument vindt dat goed bij je past. Je vult een formulier in en onze klantenservice regelt de rest.
Van wie koop ik deze samenvatting?
Stuvia is een marktplaats, je koop dit document dus niet van ons, maar van verkoper lauraakkermans2000. Stuvia faciliteert de betaling aan de verkoper.
Zit ik meteen vast aan een abonnement?
Nee, je koopt alleen deze samenvatting voor €10,39. Je zit daarna nergens aan vast.