Chapter 1 - Introduction
Multivariate analysis = analysis of multiple variables/measurements in a single
relationship or set of relationships, e.g. simultaneous analysis
of more than two variables.
Multivariate simply means to examine relationships between or among more than two
variables.
Multivariate character lies in the multiple variates (multiple combinations of variables), and
not only in the number of variables.
Variate = linear combination of variables with empirically determined weights.
Variate value = w1X1 + w2X2 + w3X3 + … + wnXn
Xn = observed variable
Wn = weight determined by multivariate technique
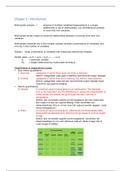
Classification of measurement scales:
• Non-metric (qualitative):
1. Nominal: categories in which there exist not order in between
(Dutch: categorieën waar geen onderling verschil/orde tussen bestaat)
2. Ordinal: categories in which their exist ordering, but without clear distance
(Dutch: categorieën waar wel een verschil/orde tussen bestaat (maar
verschil is niet goed te duiden))
• Metric (quantitative):
3. Interval: A numerical value is being given to an observation. The absolute
zero is not important, but the differences in values are interpretable. In
orther words, the values can go through the zero, such as in
temperature.
(Dutch: een numerieke waarde wordt toegekend aan een observatie.
Het nulpunt is niet van special belang, maar verschillen zijn
interpreteerbaar. M.a.w. er kan door het nulpunt worden gegaan, zoals
minus temperatuur.)
4. Ratio: A numerical value is being given, differences are interpretable AND
there exists an absolute zero. Nothing can go below 0, such as length
or age.
(Dutch: een numerieke waarde wordt toegekend, verschillen zijn
interpreteerbaar en er is een absoluut nulpunt. Niets is lager dan 0,
zoals lengte of leeftijd.
,Nominal data
• Collecting information on a variable that naturally or by design can be grouped into
two or more categories that are mutually exclusive and collectively exhaustive.
• Nominal classifications may consist of any number of separate groups if the groups
are mutually exclusive and collectively exhaustive.
• Nominal scales are the least powerful of the four data types, as they suggest no
order or distance relationship, and have no arithmetic origin.
• Since the only quantification is the number count of cases in each category (the
frequency distribution), the researcher is restricted to the use of the mode as the
measure of central tendency.
Ordinal data
• Include the characteristics of the nominal scale plus an indicator of order.
• Ordinal data are possible if the transitivity postulate is fulfilled (if a is greater than b
and b is greater than c, then a is greater than c).
• The use of an ordinal scale implies a statement of ‘greater than’ or ‘less than’
without stating how much greater or less.
• Other descriptors may be used – superior to, happier than, poorer than, or above.
• Any number of cases can be ranked: a>b>c
• Also occurs when more than one property is of interest.
• A better way is to convert ordinal data into interval data, the values of which can
then be added and averaged.
Interval data
• Have the power of nominal and ordinal plus one additional strength: they incorporate
the concept of equality of interval (the distance between 1 and 2 equals the distance
between 2 and 3), such as calendar time.
• Fahrenheit temperature scales are other examples of classical interval scales, as
both have an arbitrarily (willekeurig) determined zero point, as you can go -1 degree.
• When a scale is interval, you use the arithmetic mean as the measure of central
tendency.
• When the distribution of scores computed from interval data lean in one direction or
the other (skewed right or left), we use the median as the measure of central
tendency.
Ratio data
• Incorporate all the powers of the previous data types plus the provision for absolute
zero or origin.
• Ratio data represent the actual amounts of a variable, such as weight, height, and
distance. Everything starts from the absolute zero point: 0 cm to 180 cm. You cannot
go -1m in height or -1kg in weight.
Measurement error:
There are two major criteria for evaluating a measurement tool:
1. Validity: refers to the extent to which a test measures what we actually wish to
measure.
1. External validity: generalizable
2. Internal validity: do we measure what we want to measure?
2. Reliability: has to do with the accuracy and precision of a measurement
procedure (consistency and stability of a measure)
,Types of Statistical Error
Researchers are often interested in drawing inferences from a sample. Interpreting statistical
inferences requires specifying the acceptable levels of statistical error that result from using
a sample (known as sampling error).
Type I error: H0 is unjustified rejected – It is the probability of rejecting the null hypothesis
when it is actually true – generally referred to as a false positive.
Type II error: H0 is unjustified not rejected – It is the probability of not rejecting the null
hypothesis when it is actually false – generally referred to as a false negative.
The type I and Type II errors are inversely related. Thus, Type I error becomes more
restrictive (moves closer to zero) as the probability of a Type II error increases. That is,
reducing Type I errors reduces the pwoer of the statistical test.
Power (1 – Beta) is the probability of correctly rejecting the null hypothesis when it should
be rejected. Although specifying alpha establishes the level of acceptable statistical
significance, it is the level of power that indicates the probability of success in finding the
differences if they actually exist.
Power is determined by three factors:
• Effect size Helps researchers determine whether the observed relationship is
meaningful, e.g., could be a difference in means between two
groups or the correlation between variables.
• Alpha (a) As alpha becomes more restrictive, power decreases. Theory
suggests levels of 0.05 or 0.01.
• Sample size At any given alpha level, increased sample sizes always produce
greater power for the statistical test. Be aware that sample size can
affect the statistical test either by making it insensitive (at small
sample sizes) or overly sensitive (at very large sample sizes).
, Dependence and interdependence
A dependence technique may be defined as one in which a variable or set of variables is
identified as the dependent variable tob e predicted or explained by other variables known
as independent variables. When the research problem involves several dependent variables,
four techniques of analysis are appropriate:
• If the independent variables are non-metric, the technique of multivariate analysis of
variance (MANOVA) should be selected.
• If the independent variables are metric, canonical correlation is appropriate.
• If the several dependent variables are non-metric, then they can be transformed
through dummy variable coding (0-1) and canonical analysis can again be used.
• If a set of dependent independent variable relationships is postulated, then structural
equation modeling is appropriate.
An interdependence technique is one in which no single variable or group of variables is
defined as being independent or dependent. Rather, the procedure involves the
simultaneous analysis of all variables in the set, such as Factor Analysis. Here, the variables
cannot be classified as either dependent or independent. Instead, all the variables are
analyzed simultaneously in an effort to find an underlying structure to the entire set of
variables or subjects. Techniques involve:
• If the structure of variables is to be analyzed, then factor analysis or confirmatory
factor analysis is appropriate.
• If cases or respondents are to be grouped to represent structure, then cluster
analysis is selected.
• If the interest is in the structure of objects, the techniques of perceptual mapping
should be applied.
•