100% tevredenheidsgarantie Direct beschikbaar na betaling Zowel online als in PDF Je zit nergens aan vast
logo-home
M&A corporate governance part 1 €2,99
In winkelwagen

College aantekeningen

M&A corporate governance part 1

4 beoordelingen
 316 keer bekeken  8 keer verkocht

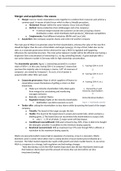
Lecture notes and slides in a nice overview from the course; corporate governance and restructuring. This is part 1 of the 2 given by Luc Renneboog on M&A

Voorbeeld 3 van de 17  pagina's

  • 20 november 2017
  • 17
  • 2017/2018
  • College aantekeningen
  • Luc renneboog
  • Corporate governance
book image

Titel boek:

Auteur(s):

  • Uitgave:
  • ISBN:
  • Druk:
Alles voor dit studieboek (2)
Alle documenten voor dit vak (2)

4  beoordelingen

review-writer-avatar

Door: dudekpawel • 6 jaar geleden

review-writer-avatar

Door: daniquesabel • 7 jaar geleden

review-writer-avatar

Door: Dirkdirkdirk • 6 jaar geleden

review-writer-avatar

Door: jorisgijsbers • 7 jaar geleden

avatar-seller
maikelvogelaar
Merger and acquisitions: the waves
 Merger: two (or more) corporations come together to combine their resources and achieve a
common goal. In means of joint forces which is often a friendly procedure.
o Horizontal: Merger within the same industry (Coca Cola and Pepsi).
o Vertical: Same production chain (Volkswagen and a tire company);
 A vertical merger towards the customer can be seen as buying a shares
distribution center, which distributes both products  Eliminate competition;
o Conglomerate: Total different industries (BMW and Coca Cola).
 Acquisition: One company acquires shares and control of another company

The main goal of M&A is to generate value for their shareholders, whereas the value of the new firm
should be higher than the sum of the bidder and target (synergy). On top of that, M&A also can be
seen as a corporate governance device whereas the way a M&A is regulated and happening
influences the ownership structure. The most active takeover market will be the efficient one having a
dispersion (low concentration) of ownership (i.e. no big controlling blocks). A good example with a
non-active takeover market is Germany with its high ownership concentration.

The shareholder pyramid, figure 1, (ownership pyramid) is a control
chain of 50%+1. In this case, having 50%+1 in company C means that C - having 50%+1 in B
you have the majority vote in Company L. Hence, 1/8 th of revenues of
company L are owned by Company C. As such, a lot of power is
B - having 50%+1 in A
acquired with rather little cash asset.

 Corporate governance: Ways in which suppliers of finance to
A - having 50%+1 in L
corporations assure themselves of getting a return on their
investment.
o Make sure minority shareholders fully obtain gains L - Owned by A and
from mergers by constraining and monitoring minority shareholders
managers behavior;
o Basically, a contract theory. (minority)shareholders
o Regulative focus Rights of the minority shareholder.
 Debtholders use debt covenants as such. Figure 1 - shareholder pyramid
 Tender offer: asking the shareholders to buy shares whilst by-passing the board of the target
company.
o Friendly: The board of the target accepts the bid;
o Hostile: The board of the target doesn’t accept and counter bids, which unchains a
bidding-game.  The board does not recommend the shareholders to accept a bid;
 only 1 – 1.5% of all deals.  major event with big impact.
o Conditional (unconditional): Will want at least to buy 50%, if less is able to be bought
the deal gets canceled. A condition to the minimum buying capacity;
o Restricted (unrestricted): Will as maximum buy 57% even though 90% is offered. A
restriction to the maximum buying capacity.

M&A’s are procyclical which means high in expansion of economy, a low in a recession. M&A’s
therefore come in waves which often end in a steep decline of stock market prices followed by a
recession. The M&A-market expands due rapid credit growth and stock market booms. In any sense,
M&A is a response to a change, both regulatory and technology changes.
*Note that during a crisis the M&A-market drops down due the fact that banks need to get
their balance sheets down and the amount of money they can lend will be cut (less
investment funding)

,An all-stock offer will be interesting whenever the bidding firm has a high market to book ratio.
Saying, the firm is overvalued by the market and using their shares as payment is relative cheap
money. The M&A market shows a boom from off 1995 (boom in the equity market) and a major
decline around 2000 (dotcom bubble). Depreciation of a currency to another increases the deal
volume of M&A. The one currency, and hence the companies, become cheaper and therefore a
bigger target.

Takeover waves
Merging for monopoly (1890-1905), merging for oligopoly (1920s) and merging for growth (1960s)
 1st 1897-1904(industrial revolution) Monopoly wave: Many of horizontal mergers took place
increasing the market power to monopoly form. Eventually the law broke it down and it
created oligopoly;
 2nd 1916-1929 Oligopoly wave: Breaking up the larger companies to form an oligopoly by
anti-trust laws insisting vertical mergers. Can be seen as the beginning of geographical
mergers where companies formed the same formula overseas and causes development of
retail chains;
 3rd 1940-1950 Friendly acquisition wave: Many small businesses were acquired in a friendly
setting;
 4th 1965-1969 Conglomerate wave: The making of an empire and merging for growth,
conglomerate got introduced to become as big as possible;
 5th 1982-1989 Corporate governance deregulation wave: The conglomerate’s broke down
and started to trade as discount. Where the separate units had a total worth higher than the
conglomerate itself. Introduction of an anti-takeover legislation impairing that the company
might get lazy due to the reduced risk of being taken over (Hated by the shareholder as the
company isn’t as efficient anymore);
 6th 1993-2000 Globalization waves: Many horizontal mergers which were strategic and
expensive (high premiums). Much cross-border deals and much equity (stock) deals.

Why did it come in waves? Eventually the M&A market is change driven, major changes did come in
waves. Technological changes, globalization, deregulation, economies of scale and scope (cost
sharing), industry changes and stock price increase & interest rate decrease.

Company valuation for mergers (I) – Multiples, comparables.
 Value based on;
o Value of publicly traded companies;
o Comparable deals.
Cash flow bases value multiples;
Market value of the firm over; Earnings, EBITDA and FCF
Cash flow based price multiples;
Price of a firm over; Earnings (P/E), EBITDA and FCF
Asset based multiples;
MV of firm/ BV of assets; MV of equity/ BV of equity (M2B)

Tobin’s Q = Market value of the firm/ replacement of assets (depreciated)
= Market value (E+D) / Book value (E+D)
MVe = number of shares x price, MVd = hard to estimate
MVe + BVd
≈ BVe+ BVd  MVd is proxied as BVd

, By means of multiples any number can be acquired and therefore used as negotiation means.
FCF MV 1
Market value= → =
Wacc−g FCF Wacc−g

Whereas, MV/FCF can be seen as a multiple.
D E '
WACC= ∗Rd ( 1−Tc ) + ∗ℜ(1−T )  (1-T’) equals NID measure.
E+ D E+D

Valuing using multiples regards a choice, the target wants a high value whereas the bidder wants a
lower value.
Valuing ADI


P/e = 20.9 x (1-15%)=17.8  1-15% is a discount reasoned as underperforming of ADI. Ad-hoc
markdown
Equity value = P/e x earning (net income) = 17.8x119.3=2135
Stock price = Equity value / number of shares = 2135/114.5 = $18.60

Company valuation for mergers (I) – DCF.
 Value of a target (stand-alone)  share price can be mispriced.
 Quantify synergy (exploit of scale and scope of economy) to account the maximum price
1. Value the stand-alone company
2. Calibrate the valuation model
3. Value the synergy
4. 1+3 gives the maximum to be paid value
 Method 1: NPV/Wacc  The WACC is adjusted for the tax shield
1. Forecast expected FCF
2. Estimate WACC – in nominal rate. (real rate = minus inflation)
3. Compute PV
o FCF=EBIT(1-Tc)+Depreciation
Amortization-CapEx-Delta NWC
(payable, receivable, inventory)
In 2015
EBIT=1200-850-35 = 315 ; t=38%
Change in NWC = (60+60-25)
(2015) – (50+50-20) (2014) = 15
FCF=315 (1-0.38) +35-40-15 =
175.3

Voordelen van het kopen van samenvattingen bij Stuvia op een rij:

Verzekerd van kwaliteit door reviews

Verzekerd van kwaliteit door reviews

Stuvia-klanten hebben meer dan 700.000 samenvattingen beoordeeld. Zo weet je zeker dat je de beste documenten koopt!

Snel en makkelijk kopen

Snel en makkelijk kopen

Je betaalt supersnel en eenmalig met iDeal, creditcard of Stuvia-tegoed voor de samenvatting. Zonder lidmaatschap.

Focus op de essentie

Focus op de essentie

Samenvattingen worden geschreven voor en door anderen. Daarom zijn de samenvattingen altijd betrouwbaar en actueel. Zo kom je snel tot de kern!

Veelgestelde vragen

Wat krijg ik als ik dit document koop?

Je krijgt een PDF, die direct beschikbaar is na je aankoop. Het gekochte document is altijd, overal en oneindig toegankelijk via je profiel.

Tevredenheidsgarantie: hoe werkt dat?

Onze tevredenheidsgarantie zorgt ervoor dat je altijd een studiedocument vindt dat goed bij je past. Je vult een formulier in en onze klantenservice regelt de rest.

Van wie koop ik deze samenvatting?

Stuvia is een marktplaats, je koop dit document dus niet van ons, maar van verkoper maikelvogelaar. Stuvia faciliteert de betaling aan de verkoper.

Zit ik meteen vast aan een abonnement?

Nee, je koopt alleen deze samenvatting voor €2,99. Je zit daarna nergens aan vast.

Is Stuvia te vertrouwen?

4,6 sterren op Google & Trustpilot (+1000 reviews)

Afgelopen 30 dagen zijn er 52928 samenvattingen verkocht

Opgericht in 2010, al 14 jaar dé plek om samenvattingen te kopen

Start met verkopen
€2,99  8x  verkocht
  • (4)
In winkelwagen
Toegevoegd