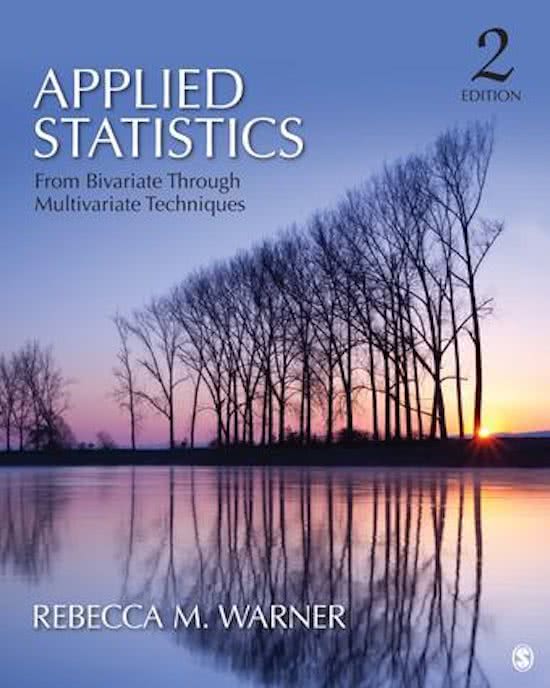
Applied statistics I, Basic Bivariate Techniques. Rebecca Warner. Third edition.
Chapter 1 – Evaluating numerical information
1.1 Introduction and 1.2 Guidelines for numeracy
In science and technical fields, the term statistics describes techniques for analysing and interpreting
numerical information. Numeracy skills are needed to understand and evaluate how numerical
information is collected, analysed and presented. This chapter considers important issues in the
communication of numerical information.
1.3 Source credibility
Communicators can be motivated by self-interest or bias. This raises concerns about credibility of
messages. The selection of information can be influenced by confirmation bias, a preference for
information that confirms pre-existing ideas or beliefs. Another thing that happens is cherry-picking,
were some important information is excluded.
A primary source is a research report written by a researcher who has first-hand knowledge of
behaviours and events in a study. Such reports are published in science journals. A secondary source
is a description or summary of past research created by someone who did not work on the research
itself. Then there is third-party content, what is often published by news organizations, were
information is often not complete or accurate. The communicator is more accurate and believable if
he or she has an advanced degree, for example PhD. There are also organizations that evaluate
communicator track record for truth-telling in journalism.
1.4 Message content
An anecdote is a story, often about an individual or situation. First-person anecdotes are called
testimonials. Problems with anecdotes is that they are often not accurate or not generalizable. In
science, a detailed report of an individual or situation is called a case study.
In science, identification of outside sources of evidence is done by citation. It gives credit to other for
their ideas and avoids plagiarism. It also shows how the present study is built upon existing
knowledge.
1.5 Evaluating generalizability
The degree of generalizability of results is to which a researcher can claim that the results obtained
are representative for the population of interest. In science communication, authors are expected to
discuss limitations that must be considered before drawing conclusions.
1.6 Making causal claim
In science and the daily life we want to know about causal connections. Causal explanations tie
events together in meaningful ways. The ‘Post Hoc, Ergo Propter Hoc’ fallacy is often used by people
to reason that event A happened and caused event B, which is often not even true. It is poor quality
reasoning that could lead to mistaken beliefs in causality.
Correlation can be used in two ways. First to refer to the Pearson product-moment correlation, also
called Pearson’s r. Second, is in a broader sense, that variables are correlated if they are statistically
related using some statistical analysis. The existence of a statistical association is not enough
evidence by itself to prove causality. Correlation is a necessary but not sufficient condition for making
causal inference.
,Most association in behavioural and social science are not perfect. Think about the relation between
smoking and lung cancer. The risk of getting cancer is higher when you smoke, but a lot of smokers
do not get lung cancer. In these imperfect associations, it is likely that other variables are involved.
1.7 Quality control mechanisms in science
There are controls for quality in science:
1. Peer review: research reports are send to reviewers that provide detailed criticism of studies
and evaluation.
2. Replication: repeating a study. This can be exact with all the same methods, or conceptual,
with some changes.
3. Open science and study preregistration.
1.8 Biases of information consumers
The selection of information can be consistent with the pre-existing beliefs of the researcher. It is
helpful to consider evidence that challenges the beliefs of the researcher. The social influence of
incorrect beliefs is a big problem. But even in science, consensus does not always guarantee
accuracy.
1.9 Ethical issues in data collection an analysis
Ethical issues arise when collecting data about people or animals. Research involved is evaluated by
an institutional review board. Ethical issues are throughout the whole research, from data collection
to reporting.
1.10 Lying with graphs and statistics
Falsification of data is rare, but misleading happens quite often in research. Deceptive bar graphs are
the most common way information communicators mislead information consumers.
1.11 Degrees of belief
In science, we often do not have enough information to be confident about the conclusions. It is
useful to think about scientific knowledge in terms of degree of belief instead of certainty.
Chapter 2 – Basic research concepts
2.1 Introduction
Data or data set refers to information, usually in numerical form in a computer file, about multiple
cases and/or multiple variables. Analysis refers to statistical techniques. A variable is a characteristic
that differs or varies across subjects or cases. Subjects or cases are the entities or observational units
studied.
2.2 Types of variables
Categorical variables identify group membership for each case. They are also called nominal
variables, because numbers serve only as names or labels for groups. Examples are sex (1= male,
2=female, 3= X) or marital status. You cannot compare these variables with arithmetic operations (+,
-, X and /).
Quantitative variables indicate ‘how much’ of some characteristic/behaviour each case or person
has. It is reasonable to apply arithmetic operations to numerical values for quantitative values.
Ordinal variables are scores that correspond to ranks. This is not a measure, therefore these are not
often used in behavioural and social sciences.
,The different variables require different types of descriptive statistics, graphs and other analyses. A
Likert scale is often used in personality research, which consists a statement and choice among
answers in agreement (strongly agree, agree, neutral, disagree, strongly disagree).
With scores that represent counts or consist of counts, it sometimes makes more sense to handle
them as categorical, and it sometimes makes more sense to treat them as quantitative.
2.3 Independent and dependent variables
Research usually begins with questions about the way two or more variables are related. It makes
sense to identify one variable as the independent variable (X) and the dependent or outcome
variable (Y).
2.4 Typical research questions
Three types of research questions about the relationship between two variables:
1. Are X and Y correlated?
Are they statistically related? For this question, one variable has to be independent and the other has
to be dependent. The term correlated can refer specifically to the results of a Pearson r correlation
analysis, but is also often used to refer any statistical relationship.
2. Does X predict Y?
X is in this case the predictor, the independent variable and Y the outcome, dependent variable. A
predictor should occur before the outcome, this is called temporal precedence.
3. Does X cause Y?
The word cause can also be: change, increase, decrease, influence et cetera.
2.5 Conditions for causal inference
When researcher select variables to include in a study, they should consider that there should be a
plausible theory that explains why X and Y might be related. There are three more conditions:
- We can say that X and Y are associated if they are statistically related, you will use the statical
analyses such as the independent-samples t-test and Pearson correlation.
- X can only predict Y if X happens earlier in time than Y and is statistically related to Y.
- X must be the only possible explanation for changes in Y.
Rival explanatory variables or confounded variables arise in situations where many variables might
cause or influence Y. You need to these there in control or take them into account in statistical
analysis. If two potential causal or independent variables co-occur, we say that they are confounded.
2.6 Experimental research design
A typical experimental research design includes two or more groups of cases, each group exposed to
a different type or amount of treatment. These experiments require comparisons. In many studies a
control group with no treatment is included. In these cases, it is important to think about how to
sample the groups. Trying to keep other variables the same across participants between and within
groups is called standardization.
2.7 Nonexperimental research design
In a typical nonexperimental research design, also called correlational study, a researchers measures
two or more variables that are believed to be meaningfully related. One requirement is that the
variable thought to be the cause should happen earlier in time than the variable thought to be the
, outcome. Researchers often identify variables in nonexperimental studies as independent and others
as dependent, on the basis of theories about possible causal connections. However, distinctions
between independent and dependent variables in nonexperimental studies are sometimes arbitrary.
Sometimes it is better to say that X and Y are correlated variables instead of calling one independent
and the other dependent.
2.8 Quasi-experimental research designs
Studies that compare group outcomes but lack the full set of controls in true experiments are called
quasi-experiments. They fall between experimental and nonexperimental in their ability to rule out
rival explanatory variables.
2.9 Other issues is design and analysis
The three types of design differ in the amount of control a researcher has over assignment to groups
and ability to rule out rival explanatory variables. A study has a high internal validity when control of
rival explanatory variables is so thorough that there are no rival explanatory variables to worry about
when making a causal inference. External validity refers to the similarity of the situation in the study
to real-world situations we would like to be able to talk about. Nonexperimental research has higher
external validity than experimental research, because researchers observe or ask naturally occurring
behaviours.
An issue to consider is whether the groups in a design are between-S or within-S. In a between-S
study, each participant is assigned to just one group and contributes one score for the outcome
variable. In a within-S or repeated measures study, each case or participant receives multiple
treatments.
2.10 Choice of statistical analysis
Chapter 9 to 17 describe statistics used to assess whether two variables are related. Some commonly
used statistics for each combination of variables are:
1. X is categorical, Y is categorical: X2 (chi-squared) analysis of contingency tables
A chi-squared test evaluates whether membership in one type of group is statistically related to
membership in another type of group. E.g.: Consider sex and political party, are women considered
more likely to be Democrats?
2. X is categorical, Y is quantitative: t test or analysis of variance (ANOVA)
An independent-samples t test or analysis of variance compares means scores on a dependent
variable across two or more groups. This is often used to compare groups that had a different type of
treatment or between naturally occurring groups, such as mean height between male and female
groups.
3. X is quantitative, Y is quantitative: Pearson r, bivariate regression
A Pearson correlation is used to examine scores for two quantitative variables, such as X height and Y
salary. It is an appropriate analyses only when there is a linear association between X and Y.
2.11 Populations and samples: ideal versus actual situations
Statistical techniques were developed on the basis of ideal, imaginary situations. It is often too costly
or difficult to obtain information for every case in a population. A sample can be defined as a subset
of the cases in a population. A representative sample of a population is created if the cases in the
sample have characteristics similar to those of the population.


