Samenvatting
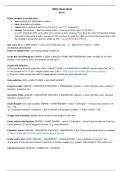
SPSS Block 1 Cheat Sheet - A summary of all necessary procedures step by step
- Instelling
- Universiteit Leiden (UL)
- Boek
- SPSS Survival Manual
This is the only document you'd need to bring with you in the SPSS Block 1 exam. It has all the procedures you need to know written clearly step by step. It is the only thing I used in my SPSS exam, and I got a 10.
[Meer zien]