Key terms – Literature test 2
Unit 13: Visualizing and analyzing bivariate relationships
Bivariate analysis: Where there are two variables
Contingency table: Sort of frequency table, but where multiple variables can be
displayed in the row/colums
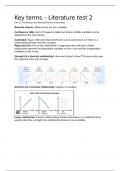
Scatterplot: Figure with dots that identify the scores and shows us if there is a
relationship between the two variables
Regression line: Line of the relationship. A regression line indicates a linear
relationship between the dependent variables on the y-axis and the independent
variables on the x-axis.
Strength (of a bivariate relationship): How much does it show? The more dots near
the regression line, the stronger
Direction (of a bivariate relationship): negative or positive
Linear relationship: A linear relationship (or linear association) is a statistical term
used to describe a straight-line relationship between two variables.
, Unit 24: Descibing the association between two variables
measure of association
A measure of association quantifies the relationship between two variables in statistical terms. The
value typically ranges from -1 to 1, where -1 indicates a perfect negative relationship, 1 indicates a
perfect positive relationship, and 0 indicates no relationship. Various techniques are available to
measure different types of associations, like linear or ordinal.
correlation
Correlation is a specific type of measure of association that captures the linear relationship between
two continuous variables. It tells you both the direction (positive or negative) and the strength (how
close the variables are to a straight line) of the relationship.
strength (of a relationship)
The strength of a relationship refers to the degree to which one variable can predict another. This is
often represented numerically, with values closer to 1 or -1 signifying a strong relationship and values
closer to 0 signifying a weak relationship.
Pearson's r
Pearson's r is the most commonly used correlation coefficient for measuring the strength and
direction of a linear relationship between two continuous variables. It ranges from -1 to 1, with -1
indicating a perfect negative linear relationship, 1 indicating a perfect positive linear relationship, and
0 indicating no linear relationship.
Spearman's rho
Spearman's ρ is a non-parametric measure used to quantify the strength and direction of an ordinal
association between two variables. It is especially useful when the data are not normally distributed
or when you're dealing with rankings. Like Pearson's r, it ranges from -1 to 1.
Kendall's tau-b
Kendall's τ−b is another non-parametric measure used to determine the strength and direction of an
ordinal relationship between two measured quantities. Unlike Spearman's ρ, Kendall's τ−b accounts
for ties in the data. It also ranges from -1 to 1.
Kendall's tau-c
Kendall's τ−c is an extension of τ−b and is used when the data set has more than a moderate amount
of tied ranks. It provides a more accurate measure of association when ties are present in both
variables.
Cramér's V
Cramér's V is a measure of association for nominal (categorical) variables. It ranges from 0 to 1,
where 0 indicates no association and 1 indicates a perfect association. It's often used in the context of
a chi-square test for independence.
Voordelen van het kopen van samenvattingen bij Stuvia op een rij:
Verzekerd van kwaliteit door reviews
Stuvia-klanten hebben meer dan 700.000 samenvattingen beoordeeld. Zo weet je zeker dat je de beste documenten koopt!
Snel en makkelijk kopen
Je betaalt supersnel en eenmalig met iDeal, creditcard of Stuvia-tegoed voor de samenvatting. Zonder lidmaatschap.
Focus op de essentie
Samenvattingen worden geschreven voor en door anderen. Daarom zijn de samenvattingen altijd betrouwbaar en actueel. Zo kom je snel tot de kern!
Veelgestelde vragen
Wat krijg ik als ik dit document koop?
Je krijgt een PDF, die direct beschikbaar is na je aankoop. Het gekochte document is altijd, overal en oneindig toegankelijk via je profiel.
Tevredenheidsgarantie: hoe werkt dat?
Onze tevredenheidsgarantie zorgt ervoor dat je altijd een studiedocument vindt dat goed bij je past. Je vult een formulier in en onze klantenservice regelt de rest.
Van wie koop ik deze samenvatting?
Stuvia is een marktplaats, je koop dit document dus niet van ons, maar van verkoper 2irislammers. Stuvia faciliteert de betaling aan de verkoper.
Zit ik meteen vast aan een abonnement?
Nee, je koopt alleen deze samenvatting voor €5,24. Je zit daarna nergens aan vast.