Research Methodology and Descriptive Statistics (RMDS)
Test 2: 13, 24, 12, 14, 15, 16, 17, 18, 19, 20, 21, 22 + R TEST
Unit 13: Visualizing and analyzing bivariate relationships
Key terms:
◼ Bivariate analysis ◼ Strength (of a bivariate relationship)
◼ Contingency table ◼ Direction (of a bivariate
◼ Scatterplot relationship)
◼ Regression line ◼ Linear relationship
- Differentiate between bivariate and univariate graphs and tables (and you know when to use
what kind of display)
- Create a scatterplot (using statistical software and by hand) with the independent variable on
the X-axis and the dependent variable on the Y-axis
- Create a contingency table (using statistical software and by hand) with the independent
variable in the columns, the dependent variables in the rows, and column percentages in the
cells
- Interpret results that are displayed in scatterplots and contingency tables
Bivariate analysis
= the analysis of two variables simultaneously, for the purpose of determining the empirical
relationship between them. The construction of a simple percentage table or the computation of a
simple correlation coefficient are examples of bivariate analysis.
We can display relationships between two variables by means of tables and by means of graphs. When
the variables in the study are measured on a nominal or ordinal level, we use a contingency table and
when they are measured on a quantitative level, we use a scatterplot.
Contingency table (cross table)
= a format for presenting the relationship among variables as percentage distributions; typically used
to reveal the effects of the independent variable on the dependent variable. Enables you to display the
relationship between two ordinal or nominal variables.
1
, Research Methodology and Descriptive Statistics (RMDS)
Test 2: 13, 24, 12, 14, 15, 16, 17, 18, 19, 20, 21, 22 + R TEST
It is similar to a frequency table but the major difference is that a frequency table always concerns
only one variable whereas the contingency table concerns two variables.
The different numbers of cases (absolute numbers) in the columns and rows don’t tell you about the
correlation between the two variables. It provides you more insight when you compute the percentages
(= column percentages = (cell / total column) x 100)). This means that for every cell we compute the
percentage of cases in that cell, compared to the total number of cases in the corresponding column.
We can express these percentages as proportions (45% becomes 0.45). We call these proportions,
conditional proportions because the formation is conditional on another variable (chocolate
consumption). We can also ignore the information we have about chocolate consumption and use the
counts in the margin of the table, these are marginal proportions. This proportion tells you that 17%
of the respondents in this study weight less than 50 kilograms.
What does it mean?
- Those who eat more than 150 grams of chocolate, 56% weights 90 kilograms or more
- Those who eat less than 50 grams of chocolate only 5% weights 90 kilograms or more
- Those who eat less than 50 grams of chocolate 45% weights less than 50 kilograms
- Those who eat more than 150 grams of chocolate, 2% weights less than 50 kilograms
Conclusion: those who eat more chocolate are also more likely to weigh more and those who eat less
chocolate are also more likely to weigh less. In other words, the percentages show that there is a
correlation between chocolate consumption and body weight.
2
, Research Methodology and Descriptive Statistics (RMDS)
Test 2: 13, 24, 12, 14, 15, 16, 17, 18, 19, 20, 21, 22 + R TEST
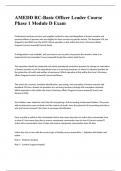
Scatterplot
= uses dots to represent values for two different numeric variables, best way to display the relationship
between quantitative variables
Making a scatterplot: draw to lines (1. x-as = horizontal as = independent variable, 2. y-as = vertical
as = dependent variable). If there is no distinguish between dependent and independent variable the
placement on the y axis and x axis is a matter of choice.
Example: our study shows that the lowest amount of chocolate is equal to 0 grams per week and the
highest amount is 700 grams per week. We display these values on the x as. Similarly, the minimum
value when it comes to body weight is 40 kilograms and a maximum value is 110 kilograms.
Conclusion: The scatter plot shows you ate a glance that there is a relationship between chocolate
consumption and body weight. The more chocolate you eat the higher your body weight.
Multiple boxplots
This gives you a good idea of the spread of the data (method 3; spread is huge)
3
, Research Methodology and Descriptive Statistics (RMDS)
Test 2: 13, 24, 12, 14, 15, 16, 17, 18, 19, 20, 21, 22 + R TEST
Unit 24: Describing the association between two variables
Key terms:
◼ Measure association ◼ Spearman’s rho
◼ Correlation ◼ Kendall’s tau-b
◼ Strength (of a relationship) ◼ Kendall’s tau-c
◼ Pearson’s r ◼ Cramér’s V
- Select the correct measure of association to quantify the association between two variables
given the measurement levels of the variables
- Compute different measures of association using statistical software
How to describe bivariate associations:
◼ Sign of the relationship: positive ↑ or negative ↓
◼ Strength: all measures of association (MOA) describe the relationship with a number
o -1 and 1, if a sign is meaningful
o Between 0 and 1, if a sign is not meaningful (nominal variables; association between
gender, color and cars for example)
◼ Significance: looking at our sample results, how certain are we about the existence of the
association between X and Y in the population (or maybe it is a consequence of change)
Strength of bivariate relationships: Measures of Association (MOA)
‘Measures of association’ refers to a wide variety of coefficients that measures (the direction and) the
strength of an association between two variables (bivariate) in a dataset. Most of the coefficients can
take values between -1 (perfect negative association) and +1 (perfect positive association), with 0
meaning no relationship at all (values close to 0 can be seen as weak associations).
The number of coefficients that can be used to describe relationships between variables is very large.
The choice between these measures depends to a large extent on the level of measurement of the
variables that are being used.
Why so many different MOA
◼ Measurement levels are different
◼ Range of MOA: 0 to 1? Or -1 to 1
o Sign of association is useful?
▪ NO: Cramer’s V: cross table with at least one dichotomous/nominal variable:
range 0-1
▪ YES: Kendall’s Tau-B and Tau-C; Pearson’s R; Spearman’s rho: range -1 to
+1
◼ Symmetric or asymmetric relationship
o X → Y: a causal relationship (= asymmetric)? → other MOA
o X – X or Y – X or X – Y: association is symmetric = no clear cause and effect
variables:
▪ Cramer’s V
▪ Kendall’s Tau B vs C
▪ Pearson’s R
▪ Spearman’s R = rank order correlation (non-normal distribution)
4
Test 2: 13, 24, 12, 14, 15, 16, 17, 18, 19, 20, 21, 22 + R TEST
Unit 13: Visualizing and analyzing bivariate relationships
Key terms:
◼ Bivariate analysis ◼ Strength (of a bivariate relationship)
◼ Contingency table ◼ Direction (of a bivariate
◼ Scatterplot relationship)
◼ Regression line ◼ Linear relationship
- Differentiate between bivariate and univariate graphs and tables (and you know when to use
what kind of display)
- Create a scatterplot (using statistical software and by hand) with the independent variable on
the X-axis and the dependent variable on the Y-axis
- Create a contingency table (using statistical software and by hand) with the independent
variable in the columns, the dependent variables in the rows, and column percentages in the
cells
- Interpret results that are displayed in scatterplots and contingency tables
Bivariate analysis
= the analysis of two variables simultaneously, for the purpose of determining the empirical
relationship between them. The construction of a simple percentage table or the computation of a
simple correlation coefficient are examples of bivariate analysis.
We can display relationships between two variables by means of tables and by means of graphs. When
the variables in the study are measured on a nominal or ordinal level, we use a contingency table and
when they are measured on a quantitative level, we use a scatterplot.
Contingency table (cross table)
= a format for presenting the relationship among variables as percentage distributions; typically used
to reveal the effects of the independent variable on the dependent variable. Enables you to display the
relationship between two ordinal or nominal variables.
1
, Research Methodology and Descriptive Statistics (RMDS)
Test 2: 13, 24, 12, 14, 15, 16, 17, 18, 19, 20, 21, 22 + R TEST
It is similar to a frequency table but the major difference is that a frequency table always concerns
only one variable whereas the contingency table concerns two variables.
The different numbers of cases (absolute numbers) in the columns and rows don’t tell you about the
correlation between the two variables. It provides you more insight when you compute the percentages
(= column percentages = (cell / total column) x 100)). This means that for every cell we compute the
percentage of cases in that cell, compared to the total number of cases in the corresponding column.
We can express these percentages as proportions (45% becomes 0.45). We call these proportions,
conditional proportions because the formation is conditional on another variable (chocolate
consumption). We can also ignore the information we have about chocolate consumption and use the
counts in the margin of the table, these are marginal proportions. This proportion tells you that 17%
of the respondents in this study weight less than 50 kilograms.
What does it mean?
- Those who eat more than 150 grams of chocolate, 56% weights 90 kilograms or more
- Those who eat less than 50 grams of chocolate only 5% weights 90 kilograms or more
- Those who eat less than 50 grams of chocolate 45% weights less than 50 kilograms
- Those who eat more than 150 grams of chocolate, 2% weights less than 50 kilograms
Conclusion: those who eat more chocolate are also more likely to weigh more and those who eat less
chocolate are also more likely to weigh less. In other words, the percentages show that there is a
correlation between chocolate consumption and body weight.
2
, Research Methodology and Descriptive Statistics (RMDS)
Test 2: 13, 24, 12, 14, 15, 16, 17, 18, 19, 20, 21, 22 + R TEST
Scatterplot
= uses dots to represent values for two different numeric variables, best way to display the relationship
between quantitative variables
Making a scatterplot: draw to lines (1. x-as = horizontal as = independent variable, 2. y-as = vertical
as = dependent variable). If there is no distinguish between dependent and independent variable the
placement on the y axis and x axis is a matter of choice.
Example: our study shows that the lowest amount of chocolate is equal to 0 grams per week and the
highest amount is 700 grams per week. We display these values on the x as. Similarly, the minimum
value when it comes to body weight is 40 kilograms and a maximum value is 110 kilograms.
Conclusion: The scatter plot shows you ate a glance that there is a relationship between chocolate
consumption and body weight. The more chocolate you eat the higher your body weight.
Multiple boxplots
This gives you a good idea of the spread of the data (method 3; spread is huge)
3
, Research Methodology and Descriptive Statistics (RMDS)
Test 2: 13, 24, 12, 14, 15, 16, 17, 18, 19, 20, 21, 22 + R TEST
Unit 24: Describing the association between two variables
Key terms:
◼ Measure association ◼ Spearman’s rho
◼ Correlation ◼ Kendall’s tau-b
◼ Strength (of a relationship) ◼ Kendall’s tau-c
◼ Pearson’s r ◼ Cramér’s V
- Select the correct measure of association to quantify the association between two variables
given the measurement levels of the variables
- Compute different measures of association using statistical software
How to describe bivariate associations:
◼ Sign of the relationship: positive ↑ or negative ↓
◼ Strength: all measures of association (MOA) describe the relationship with a number
o -1 and 1, if a sign is meaningful
o Between 0 and 1, if a sign is not meaningful (nominal variables; association between
gender, color and cars for example)
◼ Significance: looking at our sample results, how certain are we about the existence of the
association between X and Y in the population (or maybe it is a consequence of change)
Strength of bivariate relationships: Measures of Association (MOA)
‘Measures of association’ refers to a wide variety of coefficients that measures (the direction and) the
strength of an association between two variables (bivariate) in a dataset. Most of the coefficients can
take values between -1 (perfect negative association) and +1 (perfect positive association), with 0
meaning no relationship at all (values close to 0 can be seen as weak associations).
The number of coefficients that can be used to describe relationships between variables is very large.
The choice between these measures depends to a large extent on the level of measurement of the
variables that are being used.
Why so many different MOA
◼ Measurement levels are different
◼ Range of MOA: 0 to 1? Or -1 to 1
o Sign of association is useful?
▪ NO: Cramer’s V: cross table with at least one dichotomous/nominal variable:
range 0-1
▪ YES: Kendall’s Tau-B and Tau-C; Pearson’s R; Spearman’s rho: range -1 to
+1
◼ Symmetric or asymmetric relationship
o X → Y: a causal relationship (= asymmetric)? → other MOA
o X – X or Y – X or X – Y: association is symmetric = no clear cause and effect
variables:
▪ Cramer’s V
▪ Kendall’s Tau B vs C
▪ Pearson’s R
▪ Spearman’s R = rank order correlation (non-normal distribution)
4