Event study
Testing a change in price around a specific event and hence examine the impact of an event
• Efficient market hypothesis: prices reflect all available and relevant information and will only
change due incoming new information. Whereas, this information cannot predict the future.
o Weak hypothesis: Price reflects all information contained in past prices and the
fundamental value itself. Where past prices are time series data and the
fundamental values are cross-sectional
o Semi-strong hypothesis: price reflects not only past information buy any published
information.
o Strong hypothesis: prices reflect any information both public and private where only
at the announcement price change should be found
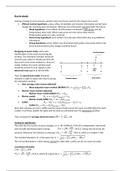
Designing an event study: starts with
identification of the event and timing the
window. The estimation window should be
around a year where it should end 20 to 30
days prior to the event window to ‘drop out’
insider trading. The event window itself
should be around 0 (-3,3). Based on the
abnormal return given as AR=Rit-NRit
Then the benchmark model should be
selected in order to obtain the returns during
the estimation window;
• Own average return (mean adjusted)
1
o Mean adjusted return method (MARM) 𝑁𝑅𝑖 = ∗ ∑𝑇2
𝑡=𝑇1 𝑅𝑖𝑡
𝑇2−𝑇1−1
• Market return (market adjusted)
o Market return model (MAM) 𝑁𝑅𝑖𝑡 = 𝑅𝑚𝑡
• Market model: 𝑅𝑖𝑡 = 𝛼 + 𝛽𝑖𝑡 (𝑅𝑚𝑎𝑟𝑘𝑒𝑡 ) + 𝜀𝑖𝑡
o Market model (MM) 𝑁𝑅𝑖𝑡 = 𝛼̂𝑖 + 𝛽̂𝑖 𝑅𝑚𝑎𝑟𝑘𝑒𝑡
• CAPM: 𝑅𝑖𝑡 − 𝑅𝑓𝑡 = 𝛼 + 𝛽𝑖𝑡 (𝑅𝑚𝑎𝑟𝑘𝑒𝑡 − 𝑅𝑓 ) + 𝜀𝑖𝑡
o CAPM 𝑁𝑅𝑖𝑡 = 𝑅𝑓𝑡 + 𝛽̂𝑖 (𝑅𝑚𝑎𝑟𝑘𝑒𝑡 − 𝑅𝑓𝑡 )
Note that i denotes an event. CAPM and the market model can be the same if ai=Rft(1-Beta) for both
models. In all these models the alpha and the beta are estimated over the estimation window.
1
̅̅̅̅ = ∗ ∑𝑁
Then compute the average abnormal return 𝐴𝑅 𝑡=1 𝐴𝑅
𝑛
Testing for significance
The main key is to test for no price changes, as in, H0: E(ARit)=0. If the AR is independent, identically
𝐴𝐴𝑅𝑡
and normally distributed (semi-strong); 𝑇𝑆𝑡1 = √𝑁 ∗ 𝜎 ~𝑁(0,1) noting that we know the
𝐴𝐴𝑅
variance. Whenever the variance is unknown; 𝑇𝑆1,𝑡 = √𝑁 ∗ 𝑆𝑡
~𝑁(0,1) which is a student T-test.
1
The standard deviation, St, is then given by; 𝑆𝑡 = √𝑛−1 ∗ ∑𝑁 ̅̅̅̅ 2
𝑖=1(𝐴𝑅𝑖𝑡 − 𝐴𝑅𝑖𝑡 )
The normal distribution is often being rejected for daily data. Luckily, we do not need normality.
Cumulative AR (CAR);
𝐶𝐴𝑅 = ∑𝑡2
𝑡=𝑡1 𝐴𝑅𝑖𝑡
𝐶𝐴𝐴𝑅 1
𝑇𝑆2 = √𝑁 ∗ ~𝑁(0,1) where St is given by 𝑆𝑡 = √𝑛−1 ∗ ∑𝑁 ̅̅̅̅ 2
𝑖=1(𝐶𝐴𝑅𝑖𝑡 − 𝐶𝐴𝑅𝑖𝑡 )
𝑆𝑡
, Complication of heterogeneity in events/firms
Different firms might have different return volatility (sd) and hence a difference in betas and thus a
different volatility of AR. In order to make sure comparison can be made the scores have to be
𝐴𝑅 1
standardized 𝑆𝐴𝑅𝑖𝑡 = 𝑆 𝑖𝑡 where 𝑆𝑖 = 𝑇2−𝑇1 ∗ ∑𝑇2 ̅̅̅̅ 2
𝑖=𝑇1(𝐴𝑅𝑖𝑡 − 𝐴𝑅𝑖𝑡 )
𝑖
with the hypothesis of NO SAR 𝑇𝑆3 = √𝑁 ∗ 𝐴𝑆𝐴𝑅𝑡~𝑁(0,1) and
𝑁
CASAR (cumulative) 𝑇𝑆3 = √ 𝑇 ∗ 𝐶𝐴𝑆𝐴𝑅𝑡~𝑁(0,1)
Complication cross sectional dependence
The fact of event clustering where multiple events are in the same period and which causes cross-
sectional correlation and hence an invalid t-stat. It can be solved by a good benchmark.
If it cannot be solved by a good benchmark;
1. Average all returns of the same calendar day and treat the whole as one observation in the
t-test. Yet, this doesn’t solve the non-perfectly overlap of events.
2. Crude dependence of standard error where the standard error of the average abnormal
return should be estimated over the estimation period
1
̅ =√
𝑆𝑖 ∗ ∑𝑇2 ̅̅̅̅ ∗ 2
𝑖=𝑇1(𝐴𝑅𝑡 − 𝐴𝑅 ) where AR* denotes the overall average of AR in the estimation
𝑇2−𝑇1
𝐴𝐴𝑅𝑡
window. The significance test is as follows; 𝑇𝑆5 = 𝑆̅
~𝑁(0,1)
Complication event induced variance
If the variance of AR is computed using cross-section, it will need a robust measure
̅̅̅̅̅̅
𝑆𝐴𝑅 1
𝑇𝑆7 = √𝑁 ∗ ~𝑁(0,1) 𝑆𝑡 = √𝑛−1 ∗ ∑𝑁 ̅̅̅̅ 2
𝑖=1(𝑆𝐴𝑅𝑖𝑡 − 𝑆𝐴𝑅𝑖𝑡 )
𝑆𝑡
̅̅̅̅̅̅̅̅
𝐶𝑆𝐴𝑅 1
𝑇𝑆8 = √𝑁 ∗ ~𝑁(0,1) 𝑆𝑡 = √𝑛−1 ∗ ∑𝑁 ̅̅̅̅̅̅ 2
𝑖=1(𝐶𝑆𝐴𝑅𝑖𝑡 − 𝐶𝑆𝐴𝑅𝑖𝑡 )
𝑆𝑡
Complication non-normality of return distribution
Skewness and outliers, which are often a small-sample problem may disturb the distribution. It is to
be solved by means of sign and rank testing.
Sign mainly tests for the sign of the coefficient and counts the fraction of positive returns;
E(p)=0.5 𝑇𝑆9 = 2√𝑁(𝑝 − 0.5)~𝑁(0,1) and is then more robust to the outlier
Rank tests both magnitude and the sign by ranking the abnormal returns during the complete period
by Kit. The empirical quantile = Uit=Kit/T
1 𝑈𝑖𝑡−0.5 1
𝑇𝑆11 = ∑𝑁
𝑛 𝑖=1 𝑆𝑢𝑡
~𝑁(0,1) so that 𝑆𝑢𝑡 = 𝑛−1
∑𝑁𝑖=1(𝑈𝑖𝑡 − 0.5)
2
Long horizon
It is not likely to rebalance the portfolio monthly and therefore a long-balanced Buy and hold will be
settled. ‘BHAR’. 𝐵𝐻𝐴𝑅 = ∏𝐻 𝐻
𝑡=1(1 + 𝑅𝑖𝑡) − ∏𝑡=1(1 + 𝑁𝑅𝑖𝑡).
The benchmark model which could be used is the Fama-French factor model
Yet, potential problems of event clustering may be that the IPO is a hot market and it needs crude
dependence. On top of that there is a survivorship and selection bias where some firms may not
survive.
• IPO underperformance
o Managers issue shares when they think they are overvalued
o Subsequent correction
o Market itself is inefficient.
Testing a change in price around a specific event and hence examine the impact of an event
• Efficient market hypothesis: prices reflect all available and relevant information and will only
change due incoming new information. Whereas, this information cannot predict the future.
o Weak hypothesis: Price reflects all information contained in past prices and the
fundamental value itself. Where past prices are time series data and the
fundamental values are cross-sectional
o Semi-strong hypothesis: price reflects not only past information buy any published
information.
o Strong hypothesis: prices reflect any information both public and private where only
at the announcement price change should be found
Designing an event study: starts with
identification of the event and timing the
window. The estimation window should be
around a year where it should end 20 to 30
days prior to the event window to ‘drop out’
insider trading. The event window itself
should be around 0 (-3,3). Based on the
abnormal return given as AR=Rit-NRit
Then the benchmark model should be
selected in order to obtain the returns during
the estimation window;
• Own average return (mean adjusted)
1
o Mean adjusted return method (MARM) 𝑁𝑅𝑖 = ∗ ∑𝑇2
𝑡=𝑇1 𝑅𝑖𝑡
𝑇2−𝑇1−1
• Market return (market adjusted)
o Market return model (MAM) 𝑁𝑅𝑖𝑡 = 𝑅𝑚𝑡
• Market model: 𝑅𝑖𝑡 = 𝛼 + 𝛽𝑖𝑡 (𝑅𝑚𝑎𝑟𝑘𝑒𝑡 ) + 𝜀𝑖𝑡
o Market model (MM) 𝑁𝑅𝑖𝑡 = 𝛼̂𝑖 + 𝛽̂𝑖 𝑅𝑚𝑎𝑟𝑘𝑒𝑡
• CAPM: 𝑅𝑖𝑡 − 𝑅𝑓𝑡 = 𝛼 + 𝛽𝑖𝑡 (𝑅𝑚𝑎𝑟𝑘𝑒𝑡 − 𝑅𝑓 ) + 𝜀𝑖𝑡
o CAPM 𝑁𝑅𝑖𝑡 = 𝑅𝑓𝑡 + 𝛽̂𝑖 (𝑅𝑚𝑎𝑟𝑘𝑒𝑡 − 𝑅𝑓𝑡 )
Note that i denotes an event. CAPM and the market model can be the same if ai=Rft(1-Beta) for both
models. In all these models the alpha and the beta are estimated over the estimation window.
1
̅̅̅̅ = ∗ ∑𝑁
Then compute the average abnormal return 𝐴𝑅 𝑡=1 𝐴𝑅
𝑛
Testing for significance
The main key is to test for no price changes, as in, H0: E(ARit)=0. If the AR is independent, identically
𝐴𝐴𝑅𝑡
and normally distributed (semi-strong); 𝑇𝑆𝑡1 = √𝑁 ∗ 𝜎 ~𝑁(0,1) noting that we know the
𝐴𝐴𝑅
variance. Whenever the variance is unknown; 𝑇𝑆1,𝑡 = √𝑁 ∗ 𝑆𝑡
~𝑁(0,1) which is a student T-test.
1
The standard deviation, St, is then given by; 𝑆𝑡 = √𝑛−1 ∗ ∑𝑁 ̅̅̅̅ 2
𝑖=1(𝐴𝑅𝑖𝑡 − 𝐴𝑅𝑖𝑡 )
The normal distribution is often being rejected for daily data. Luckily, we do not need normality.
Cumulative AR (CAR);
𝐶𝐴𝑅 = ∑𝑡2
𝑡=𝑡1 𝐴𝑅𝑖𝑡
𝐶𝐴𝐴𝑅 1
𝑇𝑆2 = √𝑁 ∗ ~𝑁(0,1) where St is given by 𝑆𝑡 = √𝑛−1 ∗ ∑𝑁 ̅̅̅̅ 2
𝑖=1(𝐶𝐴𝑅𝑖𝑡 − 𝐶𝐴𝑅𝑖𝑡 )
𝑆𝑡
, Complication of heterogeneity in events/firms
Different firms might have different return volatility (sd) and hence a difference in betas and thus a
different volatility of AR. In order to make sure comparison can be made the scores have to be
𝐴𝑅 1
standardized 𝑆𝐴𝑅𝑖𝑡 = 𝑆 𝑖𝑡 where 𝑆𝑖 = 𝑇2−𝑇1 ∗ ∑𝑇2 ̅̅̅̅ 2
𝑖=𝑇1(𝐴𝑅𝑖𝑡 − 𝐴𝑅𝑖𝑡 )
𝑖
with the hypothesis of NO SAR 𝑇𝑆3 = √𝑁 ∗ 𝐴𝑆𝐴𝑅𝑡~𝑁(0,1) and
𝑁
CASAR (cumulative) 𝑇𝑆3 = √ 𝑇 ∗ 𝐶𝐴𝑆𝐴𝑅𝑡~𝑁(0,1)
Complication cross sectional dependence
The fact of event clustering where multiple events are in the same period and which causes cross-
sectional correlation and hence an invalid t-stat. It can be solved by a good benchmark.
If it cannot be solved by a good benchmark;
1. Average all returns of the same calendar day and treat the whole as one observation in the
t-test. Yet, this doesn’t solve the non-perfectly overlap of events.
2. Crude dependence of standard error where the standard error of the average abnormal
return should be estimated over the estimation period
1
̅ =√
𝑆𝑖 ∗ ∑𝑇2 ̅̅̅̅ ∗ 2
𝑖=𝑇1(𝐴𝑅𝑡 − 𝐴𝑅 ) where AR* denotes the overall average of AR in the estimation
𝑇2−𝑇1
𝐴𝐴𝑅𝑡
window. The significance test is as follows; 𝑇𝑆5 = 𝑆̅
~𝑁(0,1)
Complication event induced variance
If the variance of AR is computed using cross-section, it will need a robust measure
̅̅̅̅̅̅
𝑆𝐴𝑅 1
𝑇𝑆7 = √𝑁 ∗ ~𝑁(0,1) 𝑆𝑡 = √𝑛−1 ∗ ∑𝑁 ̅̅̅̅ 2
𝑖=1(𝑆𝐴𝑅𝑖𝑡 − 𝑆𝐴𝑅𝑖𝑡 )
𝑆𝑡
̅̅̅̅̅̅̅̅
𝐶𝑆𝐴𝑅 1
𝑇𝑆8 = √𝑁 ∗ ~𝑁(0,1) 𝑆𝑡 = √𝑛−1 ∗ ∑𝑁 ̅̅̅̅̅̅ 2
𝑖=1(𝐶𝑆𝐴𝑅𝑖𝑡 − 𝐶𝑆𝐴𝑅𝑖𝑡 )
𝑆𝑡
Complication non-normality of return distribution
Skewness and outliers, which are often a small-sample problem may disturb the distribution. It is to
be solved by means of sign and rank testing.
Sign mainly tests for the sign of the coefficient and counts the fraction of positive returns;
E(p)=0.5 𝑇𝑆9 = 2√𝑁(𝑝 − 0.5)~𝑁(0,1) and is then more robust to the outlier
Rank tests both magnitude and the sign by ranking the abnormal returns during the complete period
by Kit. The empirical quantile = Uit=Kit/T
1 𝑈𝑖𝑡−0.5 1
𝑇𝑆11 = ∑𝑁
𝑛 𝑖=1 𝑆𝑢𝑡
~𝑁(0,1) so that 𝑆𝑢𝑡 = 𝑛−1
∑𝑁𝑖=1(𝑈𝑖𝑡 − 0.5)
2
Long horizon
It is not likely to rebalance the portfolio monthly and therefore a long-balanced Buy and hold will be
settled. ‘BHAR’. 𝐵𝐻𝐴𝑅 = ∏𝐻 𝐻
𝑡=1(1 + 𝑅𝑖𝑡) − ∏𝑡=1(1 + 𝑁𝑅𝑖𝑡).
The benchmark model which could be used is the Fama-French factor model
Yet, potential problems of event clustering may be that the IPO is a hot market and it needs crude
dependence. On top of that there is a survivorship and selection bias where some firms may not
survive.
• IPO underperformance
o Managers issue shares when they think they are overvalued
o Subsequent correction
o Market itself is inefficient.