Dit document omvat een volledige samenvatting van de benodigde kennis voor het skills tentamen van ARMS. Zo beschrijft het o.a. hoe je analyses kunt doen en welke assumpties je hierbij test.
This document entails a complete summary of all the knowledge needed for the skills test of ARMS. It des...
JASP ARMS
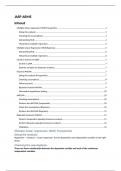
Inhoud
Multiple linear regression (MLR) Frequentist.....................................................................................1
Doing the analysis:..........................................................................................................................1
Checking the assumptions:.............................................................................................................1
Interpreting MLR.............................................................................................................................4
Hierarchical multiple regression.....................................................................................................4
Multiple Linear Regression (MLR) Bayesian........................................................................................5
Interpreting MLR.............................................................................................................................6
Hierarchical multiple regression.....................................................................................................6
Create a dummy variable....................................................................................................................7
Do this in JASP................................................................................................................................7
Dummy variables for Bayesian analyses.........................................................................................7
Factorial ANOVA.................................................................................................................................7
Doing the analysis (Frequentist).....................................................................................................7
Checking assumptions....................................................................................................................8
Follow-up tests...............................................................................................................................9
Bayesian factorial ANOVA...............................................................................................................9
Informative hypotheses testing....................................................................................................10
ANCOVA............................................................................................................................................10
Checking assumptions..................................................................................................................10
Perform the ANCOVA (frequentist)...............................................................................................10
Check the assumptions (Bayesian)................................................................................................10
Perform the ANCOVA (Bayesian)...................................................................................................11
Repeated measures ANOVA..............................................................................................................11
Perform frequentist repeated measures analysis.........................................................................11
Perform Bayesian repeated measures analyses............................................................................12
Mediation.....................................................................................................................................12
Multiple linear regression (MLR) Frequentist
Doing the analysis:
Regression -> Classical -> Linear regression. Put the dependent and independent variables in the right
boxes.
Checking the assumptions:
There are linear relationships between the dependent variable and each of the continuous
independent variables.
, Check this using a scatterplot. A scatterplot has the (continuous) predictor on the x-axis and the
outcome on the y-axis and uses dots to represent the combination of x-y-scores for each case in the
data. A linear relationship means that the scores in the scatterplot form a cloud with an oval shape
that can be describe reasonably well by a straight line.
How to make a scatterplot: Descriptives -> Add the variables in the Variables box -> Scroll down to
Plots and tick Correlation plots in Basic plots
There are no outliers.
An outlier is a case that deviates strongly from other cases in the data set. You can check them by
looking at scatterplots, boxplots, Standard residuals and Cook’s distance.
How to check: Scroll down to Statistics, tick Casewise diagnostics and then select either Standard
residual or Cook’s distance.
A rule of thumb for the standardized residuals is that the values should be between -3.3 and +3.3.
Values bigger or smaller than that indicate potential outliers.
Cook’s distance indicates the overall influence of a respondent on the model. As a rule of thumb, we
maintain that values for Cook’s distance must be lower than 1. Values higher than 1 indicate
influential cases.
What to do with outliers?
1. Do nothing
2. Exclude the data point from the analysis
3. Change the data point either to the ‘correct’ value (only if the outlier is known to be an error
and when the correct value is known), or to a less extreme value. This way this case still has a
large score, but not so extreme that it will completely dominate the results of the analysis.
Absence of multicollinearity
Multicollinearity indicates whether the relationship between two or more independent variables is
too strong. Scroll down to Statistics and tick Collinearity diagnostics.
Voordelen van het kopen van samenvattingen bij Stuvia op een rij:
Verzekerd van kwaliteit door reviews
Stuvia-klanten hebben meer dan 700.000 samenvattingen beoordeeld. Zo weet je zeker dat je de beste documenten koopt!
Snel en makkelijk kopen
Je betaalt supersnel en eenmalig met iDeal, creditcard of Stuvia-tegoed voor de samenvatting. Zonder lidmaatschap.
Focus op de essentie
Samenvattingen worden geschreven voor en door anderen. Daarom zijn de samenvattingen altijd betrouwbaar en actueel. Zo kom je snel tot de kern!
Veelgestelde vragen
Wat krijg ik als ik dit document koop?
Je krijgt een PDF, die direct beschikbaar is na je aankoop. Het gekochte document is altijd, overal en oneindig toegankelijk via je profiel.
Tevredenheidsgarantie: hoe werkt dat?
Onze tevredenheidsgarantie zorgt ervoor dat je altijd een studiedocument vindt dat goed bij je past. Je vult een formulier in en onze klantenservice regelt de rest.
Van wie koop ik deze samenvatting?
Stuvia is een marktplaats, je koop dit document dus niet van ons, maar van verkoper Loissnoek. Stuvia faciliteert de betaling aan de verkoper.
Zit ik meteen vast aan een abonnement?
Nee, je koopt alleen deze samenvatting voor €5,49. Je zit daarna nergens aan vast.