100% tevredenheidsgarantie Direct beschikbaar na je betaling Lees online óf als PDF Geen vaste maandelijkse kosten
logo-home
Full summary ARMS (lectures, seminars, grasple) €6,59
In winkelwagen

Samenvatting

Full summary ARMS (lectures, seminars, grasple)

 5 keer verkocht

This document provides a complete overview of all the content for the ARMS course, including lecture notes, ground school lessons, and seminars. Everything is conveniently compiled into a single document!

Voorbeeld 4 van de 45  pagina's

  • 14 december 2023
  • 45
  • 2023/2024
  • Samenvatting
Alle documenten voor dit vak (9)
avatar-seller
lotte-aarts
Grasple aantekeningen:

Refresh lessons:

Correlations:

- Correlation coefficient (r): a standardized number to assess the strength of a linear
relationship
 An absolute value of 1 indicates maximum strength of a relation between two
variables
 A value of 0 indicates no linear relation between the two variables
- A high positive correlation means that when one variable increases, the other one also
increases.
- A high negative correlation means that when one variable increases, the other one
decreases.
- A correlation of 0 means that when one variable increases, that has no linear influence on the
other variable  A correlation of 0 does not mean that there is no relationship between the
two variables, it could be a non-linear relationship.
- A correlation does not say anything about the causal effects of the variables.

The linear regression model:

- Interval or ratio variables needed for a linear regression
- The regression line is used to predict the value of one variable based on the value of the
other variable
- To calculate the predicted value: regression equation
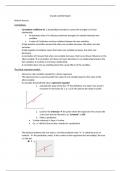
1. calculate the slope of the line  The definition of a slope: how much Y
increases if X increases by 1. (y / x) (in the picture the slope is 0,250)


2. Look for the intercept  the point where the regression line crosses the
y-axis (can also be referred to as ‘’constant" or b0)
3. Make a prediction:
 Y-value=intercept + slope × X-value
 Or : y^=b0+b1x (hat on the y stands for a prediction)


- The distance between the true value y and the predicted value ^y^ is called the error or
residual.  the predicted y value, is the y-value on the regression line (met dakje), the true
y is the dot.
 Y – y^

, - Least squares method  When we square the errors, they will always be positive and they
do not cancel each other. This way we can look for the line that will result in the smallest
possible sum of squared errors
- In JASP:


 49,050 = intercept
 3,466 = slope

Fit:

- Fit = how good the line fits with the dots on a model
- Goodness of fit number = how well the fit of the prediction is
 R^2 (R-squared)  determines the proportion of the variance of the response
variable that is 'explained' by the predictor variable(s).
Between 0 and 1
 Small R square does not mean no meaningful relationship between to variables, it
just doesn’t explain a large amount of variance

Bayesian hypothesis testing:

- NHST: the effect is either significant or not  can lead to questionable research practices
- Bayesian hypothesis testing  how much evidence we have in our data for one hypothesis
versus another hypothesis
 Bayes Factor (BF): tells us how much more one hypothesis is supported in
comparison to another.


- The support that we find in the data for a hypothesis is dependent on two things:
(1) The fit of the hypothesis to the data  becomes smaller if the distances between the
averages increases
(2) The specificity of the hypothesis  the more precise the hypothesis, the more clearer the
prediction becomes

ANOVA:

- ANOVA = a test for comparing 2 or more means (for example a t- test)
- Different kinds of t-tests:
 for one sample
 for 2 paired samples
 for 2 independent samples
> these are all for 2 variables. If you have 2 variables, the t-test for 2 independent
samples is the same as an ANOVA for 2 groups. If you have more than 2 variables,
you can only use ANOVA

, - If group means are further apart, the total variance will increase as well
- Comparing all groups at once  the difference between each datapoint and the total mean
(or grand mean) can be divided into two parts
1. The distance between the total mean and the group mean
2. The distance between the datapoint and the group mean


- This gives us 2 variances:
1. The within group variance (residual variance)  the variance of scores within each
group averaged over the groups.
2. The between group variance (explained variance)  the variation of the group means, a
measure for how different they are.
- F-statistic: is the between group variance large in comparison to the within group variance?

MS = means squared


Week 1: Multiple Linear Regressions
The Bayesian approach:

In TOE, the Bayes factor for hypothesis testing and the existence of two statistical frameworks for
data analysis were introduced

- Frequentist framework:
 Test how well the data fit H0 (NHST)
 p-values, confidence intervals, effect sizes, power analysis
- Bayesian framework:
 Probability of the hypothesis given the data
 Results depend on prior knowledge  can be a disadvantage if the prior knowledge is
incorrect
 Bayes factors (BFs), priors, posteriors, credible intervals

, 1.1 The Bayesian approach:

- The information in our dataset provides information about what reasonable values
for μ could be (through what is called the likelihood function).
- -But also the prior distribution provides information, that is, the knowledge or belief
about μ before we examine our data.
- The posterior is a compromise (combination) of the prior and likelihood. Let's examine this
visually
- Definition of probability:
 In classical / frequentist statistics there is one underlying simple definition: The
probability of an event is assumed to be the frequency with which it occurs.
 For example, if 150 out of 1000 people smoke, we could say that the probability
that some randomly picked person in that group of 1000 smokers is 0.15 (or 15 %).
This is the understanding of probabilities that is applied in the frequentist tests you
know.
 In Bayesian statistics:
o Bayes' theorem:


o conditional probabilities: P(A given B) : What is the probability that A will
happen or is true, given that we know B has happened or is true?

o P( data | null hypothesis ) - The p-value:
This is like asking, "Assuming there is no effect (null hypothesis is true),
what's the chance of seeing data as extreme as what we observed?"
It's a measure of how surprising or rare your data would be if the null
hypothesis were true.

o P( null hypothesis | data ) - What we often want to know:
This is like asking, "Given our data, what's the chance that the null hypothesis
is true?"
This is often more directly what we're interested in, but it's not what the p-
value gives us.
o In simpler terms, the p-value helps you decide if your data is surprising under
the assumption that there's no real effect. However, it doesn't tell you how
probable it is that there's no real effect in reality. For that, you would need
additional information or methods, such as Bayesian statistics, which directly
deals with the probability of hypotheses given the data.

- Frequentist interval = confidence interval  If we were to repeat this experiment many times
and calculate an interval each time, 95% of the intervals will include the true parameter value
(and 5% will not)
- Bayesian interval = credible interval  There is 95% probability that the true value is in the
interval

Dit zijn jouw voordelen als je samenvattingen koopt bij Stuvia:

Bewezen kwaliteit door reviews

Bewezen kwaliteit door reviews

Studenten hebben al meer dan 850.000 samenvattingen beoordeeld. Zo weet jij zeker dat je de beste keuze maakt!

In een paar klikken geregeld

In een paar klikken geregeld

Geen gedoe — betaal gewoon eenmalig met iDeal, creditcard of je Stuvia-tegoed en je bent klaar. Geen abonnement nodig.

Direct to-the-point

Direct to-the-point

Studenten maken samenvattingen voor studenten. Dat betekent: actuele inhoud waar jij écht wat aan hebt. Geen overbodige details!

Veelgestelde vragen

Wat krijg ik als ik dit document koop?

Je krijgt een PDF, die direct beschikbaar is na je aankoop. Het gekochte document is altijd, overal en oneindig toegankelijk via je profiel.

Tevredenheidsgarantie: hoe werkt dat?

Onze tevredenheidsgarantie zorgt ervoor dat je altijd een studiedocument vindt dat goed bij je past. Je vult een formulier in en onze klantenservice regelt de rest.

Van wie koop ik deze samenvatting?

Stuvia is een marktplaats, je koop dit document dus niet van ons, maar van verkoper lotte-aarts. Stuvia faciliteert de betaling aan de verkoper.

Zit ik meteen vast aan een abonnement?

Nee, je koopt alleen deze samenvatting voor €6,59. Je zit daarna nergens aan vast.

Is Stuvia te vertrouwen?

4,6 sterren op Google & Trustpilot (+1000 reviews)

Afgelopen 30 dagen zijn er 65907 samenvattingen verkocht

Opgericht in 2010, al 15 jaar dé plek om samenvattingen te kopen

Begin nu gratis
€6,59  5x  verkocht
  • (0)
In winkelwagen
Toegevoegd