International economics and international economic organizations
Summary
University of Antwerp - 1st semester 2017-2018
Prof. Danny Cassimon, Prof. Dirk De Bièvre, Prof. Jan Van Hove, and Prof. Glenn Magerman
Index
1. Introduction on global public goods and the balance of payment ..................................................... 3
1.1 International economics: a ‘global public goods’ approach.......................................................... 3
1.2 The concept of the balance of payments ...................................................................................... 5
2. Capital account openness, capital flows, and the link with growth and crisis (IF1) ............................ 9
2.1 Defining and measuring capital account openness....................................................................... 9
2.2 Global capital flows ..................................................................................................................... 12
2.3 The Lucas paradox ....................................................................................................................... 13
2.4 Policy implications ....................................................................................................................... 16
3. Exchange rate economics (IF2) .......................................................................................................... 17
3.1 Exchange rates............................................................................................................................. 17
3.2 Spot versus forward exchange rates ........................................................................................... 19
3.3 Tobin taxes .................................................................................................................................. 23
4. International financial crisis: concepts and institutions (IF3)............................................................ 24
4.1 Banking crisis ............................................................................................................................... 24
4.2 Exchange rate crisis ..................................................................................................................... 27
4.3 Debt crisis .................................................................................................................................... 27
4.4 Consequences of crisis ................................................................................................................ 29
4.5 International Monetary Fund ...................................................................................................... 29
5. International financial crisis in practice (IF4) .................................................................................... 34
5.1 The Latin-American debt crisis (1982-) ....................................................................................... 34
5.2 The Mexican Peso crisis (1994-95) .............................................................................................. 35
5.3 The Asian currency crisis (1997-1998)......................................................................................... 36
5.4 Global financial and economic crisis - 2007 ................................................................................ 37
6. The International Monetary System (IF5) ......................................................................................... 40
6.1 The international monetary system (IMS) .................................................................................. 40
1
, 6.2 World Bank .................................................................................................................................. 42
7. The evolution of trade and trade policy (Glenn Magerman) ............................................................ 45
7.1 40 years of globalization.............................................................................................................. 45
7.2 Supply and demand in open economy ........................................................................................ 47
7.3 Non-discriminatory trade policy.................................................................................................. 52
8. The future of (de)globalization (Jan Van Hove)................................................................................. 57
8.1 From globalization to de-globalization........................................................................................ 57
8.2 Dynamics in global trade ............................................................................................................. 57
8.3 Building stones of international trade......................................................................................... 58
8.4 Implications for welfare and economic development ................................................................ 62
9 – WTO (Dirk De Bièvre)....................................................................................................................... 64
9.1 Liberalization commitments & Rules and principles. .................................................................. 64
9.2 A forum for intergovernmental bargaining ................................................................................. 65
9.3 Enforcement: The WTO Dispute Settlement System .................................................................. 65
9.4 International Cooperation and trade .......................................................................................... 66
9.5 The GATT/WTO & Trade cooperation ......................................................................................... 67
9.6 Liberalization as a domestic problem.......................................................................................... 67
9.7 ‘Free trade Agreements undermining the WTO? ........................................................................ 67
9.8 A political economy of trade agreements ................................................................................... 68
9.10 A political economy of trade agreements (Collective action theory) ....................................... 68
9.11 Why Prefential Trade Agreement? ............................................................................................ 69
9.12 What is more desirable? FTA or WTO? ..................................................................................... 69
9.13 WTO Doha Round blockade: Is it possible to know why? ......................................................... 69
2
,1. Introduction on global public goods and the balance of payment
Literature: Gerber chapter 2 (public goods) and chapter 9 + notes from class.
1.1 International economics: a ‘global public goods’ approach
1.1.1 Public goods
There are public goods and private goods. Private goods are produced by the market mechanism, a
customer pays the price for the good and consumes it. Public goods on the other hand are accessible
to everyone, which means that the difference between public goods and private goods is based upon
exclusion and rivalry. By using these characteristics a private good or public good can be categorized.
Exclusion Public goods are nonexcludable, which means that the normal price mechanism
does not work as a way of regulating access. Whether people want to pay for the good or not,
they can use it (for example - a bridge). A private good however can exclude people (if you don’t
pay for it, you don’t have it).
Rivalry public goods are nonrivalrous or nondiminishable. These goods are not being
diminished by consumption (for example - watching TV, everyone in the city can watch the same
broadcast and will have the same ‘amount’ of signal available). Most goods get smaller when
they are consumed (like food), however public goods do not.
1.1.2 Quasi-public goods
Quasi-public goods are goods that are nonrivalrous or nonexcludable, but they are not pure public
goods. These goods only possess one out of the 2 characteristics of public goods. There are 2 types of
quasi-public goods:
Common pool resources Resources that people can consume freely, but there is rivalry in
consumption. For example fish, when someone fishes all of the fish, there is nothing left.
Club goods A ‘club’ is formed and within this club everyone can consume the services
provided in the club in a nonrivalrous way. But people that are not part of the club cannot
benefit the services and are excluded. For example Netflix, you can only enjoy Netflix if you pay
for it, but there is no rivalry among all the people that pay for Netflix.
This can be summarized in the following table:
Excludable Nonexcludable
Rivalry Private good Common pool resources
Nonrivalrous Club goods Public goods
1.1.3 Free-rider problem
But public goods come with the problem of free-riding. Free-riding means that there is no motivation
to pay for the public goods, because people cannot be excluded from consumption. Which means
that the nonexcludable characteristic of the public good leads to the problem of free-riding. The free-
riding problem leads to a problem concerning the supply of the good. When this happens, the public
good becomes under-provided or undersupplied.
To solve this problem there are mechanisms needed. On a national level do governments usually
step in, by forcing people to contribute through taxes.
3
,1.1.4 Global public goods
Global public goods are public goods are not tied to the national boundaries of a state, but are
international and available on a worldwide basis. For example the need for clean air and the problem
of air pollution. It is not that if you do not pollute the air in your country, that you are not hurt by the
pollution, which can spread to other countries. This means that there is some kind of international
action necessary to cure these problems. Sometimes a solution to these kinds of problems can best
be found at a supranational / global level. Therefore it is called a global public goods.
In addition to that, the same free-riding problem as on a national level can occur with the global
public goods. If states do not contribute to the public good, they cannot be excluded.
There are not only public goods, but also public bads. A public bad is a problem, which also can occur
on an international basis. All countries are then hit by this problem, for example an international
financial crisis. When a financial crisis hits in one country, it will spillover to other countries and
become an international financial crisis, and thus a global public bad.
Some practical examples of global public goods are:
The rules on trade The WTO deals with the rules on trade. These rules apply globally and are
therefore available to everyone and nonrivalrous.
International financial stability the goal of the IMF is financial stability and thus tries to
prevent a global financial crisis from happening. This also is a global public good, as it is
nonexcludable and nonrivalrous.
1.1.5 Different technologies of provision
The technology of provision is the process through which a public good is produced. There are 3
different technologies:
Summation Summation refers to the total production of a public good. This means the sum of
all the individual contributions (countries or individuals). So in this setting, it is important to
mobilize everyone to contribute.
For example - clean air and the problem of pollution. The more individuals prevent pollution, the
cleaner the air gets. So if everybody does an effort, even if it is small, it will help in the total
picture.
Weakest link Weakest link refers to the lowest contribution, which determents the total
supply. In this setting is the total supply equal to the effort of the weakest effort (the one with
the lowest contribution).
For example - there are 10 people on an island that each own a piece of the island, but there are
no borders on the island. Everyone on the island is asked to build a dam to protect the island
from the sea. Some people build big dams, others build small ones. However, there is 1 person
that doesn’t care about the dam and doesn’t want to spend money on it. In this case, the
protection against the sea should have been the public good. However, despite the high dams
build by others the water still comes in and will float the island due to the weakest link (who did
not build a dam). This means that in order to enjoy the public good, the focus should be on the
weakest link, which needs improvement.
Best shot Best shot refers to the highest effort, which determines the total supply. In this
setting, the total supply is equal to the one with the highest effort (the best shot).
For example - an outbreak of a disease. If this occurs and becomes a global problem, a cure
needs to be found. In this case it makes sense that the laboratory with the most resources and
4
, best people has the best chance of finding a cure. Thus, it is not efficient if 10 laboratories are
trying to find the cure, but only 1 specialized laboratory should be on the job. The cure is most
likely to be found the fastest, if the concentration is on the best shot.
1.2 The concept of the balance of payments
The balance of payments records all the border transactions flows (in monetary terms) of goods,
services, income and financial assets between domestic households, businesses and government of a
country and the rest of the world during a specific period of time. Thus, the balance of payment is a
sum of all the cross border transactions for a particular period.
1.2.1 The composition of the balance of payments
The balance of payment is divided into 3 separate parts: the current account, the capital account and
the financial account. The most important are the current account and the financial account. Goods
and services are important for the current account, whereas the capital and the financial account are
the primary record of the international flow of financial capital and other assets.
1.2.1.1 The current account
The current account measures the flow of goods and services that go in and out of the country. Thus,
all the nonfinancial transactions between a country and the rest of the world. The current account
exists out of 3 main items, which all have credit (positive) and debit (negative) components:
The trade balance
The trade balance consists of goods and services that are exported – the value of the imports. If
export – imports results in a +, then you have a surplus. In case of a deficit (imported more than
exported), you are losing reserves.
But trade does not come as easy for some countries in the world, for example Tanzania. Tanzania is a
poor country with a currency they cannot use in the international circuit. This means Tanzania needs
to generate dollar. Either the country has dollars saved from the past or generates them by
exporting. A negative trade balance can therefore problematic for these countries.
Net factor income
The net factor income refers to cross border transactions based on factors of production (labor,
capital, etc.). But, the investment income items (capital) are not movements in capital, but in the
income received or income paid on previous flows of financial capital.
Calculation of the deficit or the surplus: The income received from investments abroad – income paid
to foreigners on their investments in the US.
Labor example: Labor becomes a cross border transaction if you are resident in one country and
working in another. The salary earned in the other country is transferred to the home country.
Capital example: If the US invests in the Mexican stock market, the investment will not directly show
up in the current account (this will show up in the financial account). However, the flow of dividends
back to the US will count in the US as income received and in Mexico as income paid, which makes it
similar to payments for a service.
Current / unilateral transfers
Current transfers refer to the foreign aid or other transfers that are received from foreigners.
However it must be in the form of a grand. You receive something without obligation to give
5
,something in return. It is an important source of additional foreign exchange for poor countries.
Calculation of the deficit or surplus: any foreign aid or other transfers received from foreigners – that
given to foreigners.
A good example of a current transfer is development aid.
1.2.1.2 The capital account
The capital and the financial account both record the flow of financial capital and other assets.
However, in most countries is the capital account of lesser importance. The capital account records
some specialized types of relatively small capital flows. It includes transfers of specific types of
capital, such as: debt forgiveness, the personal assets that migrants take with them when they cross
international boundaries, the transfer of real estate and other fixed assets (such as the transfer ow
ownership).
1.2.1.3 The financial account
The financial account records the flow of financial capital. The financial account is divided into 3
categories. Important to note is that net changes are used (the difference between the assets sold
and the assets bought).
Foreign direct investment (Net changes in US owned assets abroad)
Foreign direct investment (FDI) refers to when a firm invests and opens a plant in another country.
The financial instrument used for FDI is capital in the form of shares. In the case of FDI do firms who
own the plant overseas, also own the majority of the full amount of the shares (controlling and for
the long term).
The compensation for the investment is dividend, when the firm makes a profit a part of the profit is
not put into the firm, but paid out to the shareholders. So the form of remuneration is dividend,
which is put in the net factor income category. In addition to that, the actual received payment is put
in the category foreign direct investment.
Considering the overseas country, there is an increase in foreign liabilities (the country does owe
dividend to the investing country).
Portfolio investment (Net changes in foreign-owned assets in the US)
The difference between portfolio investment and FDI is that in the case of portfolio investment you
buy the shares of a company that you are not controlling. So you do not own the majority of the full
amount of shares, you are just investing in the company. You buy the shares because you think that
the shares will rise (speculation). Another difference is that FDI focusses on the long term, while
portfolio investment focusses on the short term.
The dividend payment is also put on the net factor income. The actual payment is put in the portfolio
investment category.
Other investments (Net change in financial derivatives)
These other investments refer to loans. This can be a loan from a firm or from someone else in the
world.
If a loan comes in (borrowing country), the loan creates a foreign liability and is noted in other
investments with a + sign. On the foreign exchange this is noted with a – sign.
6
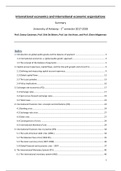
,1.2.2 (Im)balances
The current, capital and financial accounts are independent. Because the current account only
measures the goods and services and the capital and financial accounts measure financial flows,
should the sum of the capital and financial accounts be equal to the current account. In other words,
double entry accounting is used in the composition of the balance of payments. One entry indicates
the real nature, and the other entry indicates the monetary nature. This means that for every
transaction there is one + and one –. For
example – on exports you put +100 and for
the payment you put –100. This comes to 0.
If these numbers are not equal, the balance
of payments will not come to a 0. The
statistical discrepancy is the amount that the
measurement is off. This is calculated as
followed: (-1) x (balance on current account +
balance on capital and financial account).
1.2.2.1 Which sign to use (+ or –)
The sign has to be interpreted in a
counterintuitive manner. The general rule is
that everything leading to foreign exchange
income is marked with a +. This means that:
Credit (+) includes: exports, income and
current transfers received, decrease of
foreign assets, and increase of foreign liabilities.
Debit (–) includes: imports, income and current transfers paid, increase of foreign assets,
decrease of foreign liabilities.
1.2.2.2 A change in reserve assets
The reserve asset (line 11 in the example of the balance of payments aside) is the currency or other
store of value (gold) that is used by nations for their foreign reserves. The reserve assets can change
as a result of a deficit or surplus in the balance of payments.
When there is a negative sign in the balance of payments in the category of change in reserve assets
it means that there is a surplus and the reserves have increased.
In case of a positive sign there is a deficit, it means that a country has lost reserves. The country did
not generate as much foreign exchange as needed to fulfill the outgoing payments.
Calculation of the change in reserve assets: current account + capital account + financial account
(excluding changes in reserve assets) + net errors and omissions = change in reserve assets.
1.2.2.2 Errors in the balance of payments
Furthermore, each of the components on the balance of payments can individually be unbalanced. If
this is the case we speak of a surplus or deficit for that specific component.
However, mistakes are often made. In reality the balance of payments almost never leads to a 0. To
correct the balance of payments and make it a 0, you put the category ‘net errors and omissions’ on
7
,the balance of payments (also in the example above). In the net errors and omissions you put the
necessary amount to make the balance of payments 0.
When the amount in the errors and omissions becomes relatively large, it can indicate that there is
something wrong in terms of legal payments (for example – money laundering associated with the
illegal drug trade).
1.2.2.3 Problems regarding a deficit
A deficit would not necessarily be a problem when you have a trade or current account deficit. It is
more a problem when you have an overall / global deficit. This indicates a loss of foreign exchange
reserves over a given period of time. In case a country does not have enough foreign exchange
reserve holdings to cover the cap, there is a problem.
8
,2. Capital account openness, capital flows, and the link with growth
and crisis (IF1)
2.1 Defining and measuring capital account openness
Capital account openness refers to international capital cross border flows. It means easing
restrictions on capital flows across a country’s border and often results in a higher degree of financial
integration in the global economy (higher volumes of capital inflows and outflows).
Other words for capital account openness are international financial integration and financial
globalization.
2.1.1 Defining capital account openness
There are 2 ways in defining capital account openness:
2.1.1.1 De jure perspective
De jure refers to what the policy in a country stands for, and is thus based upon the government. It
measures whether a country’s government allows particular cross border transactions or not. So a
government can try to steer or prohibit these cross border cash flows. Furthermore, a policy maker
can also discourage certain types of transactions through taxes (the government penalizes you for
these transactions).
De jure ranges from allowing nothing (which means a fully closed financial account) to full openness
of transactions (complete freedom and no taxes at all). Most advanced countries are close to
complete freedom. North-Korea is currently the most extreme case of a country who does not allow
cross border transactions.
2.1.1.2 De facto perspective
The de facto perspective revers to the actual transactions that are taking place. You just measure
how many cross border transactions / capital account transactions are taking place. The de facto
measure tries to take into account how much a country in practice is integrated into international
capital markets.
However, complete freedom of transactions (de jure), does not necessarily mean that the de facto is
high. There is not necessarily a correlation between de jure and de facto. A country with a fully open
financial account does not necessarily have a wide range of cross border transactions. Therefore it is
important to look at both concepts.
For example - China’s relatively closed economy. In the de jure perspective is the economy of china
relatively closed, however the country is receiving a lot of capital flows.
For example – the African countries have a relatively open economy, however no one invests.
There is only one correlation between the two perspectives. When a country does not allow de jure,
then this country won’t have any cash flows, which makes the de facto 0. This is the case in North-
Korea.
9
, 2.1.2 Measures
The concepts de jure and de facto can both be measured. However, measuring the extent of a
country’s integration into global financial markets can be a complicated issue. In particular, the
distinction between de jure and de facto is very important in understanding the macroeconomic
implications of financial globalization.
2.1.2.1 Measuring de jure
De jure can be measured by using 2 instruments: AREAER and the Chinn-Ito index (KAOPEN).
The Annual Report on Exchange Arrangements and Exchange Restrictions (AREAER) is created by the
IMF and measures over 60 different types of controls. It is a source of qualitative information that is
available for all countries. However, the information in the report is hard to read, so first the
information has to be analyzed. This analysis is done with the Chinn-Ito index or KAOPEN (Chinn and
Ito introduced the index).
The KAOPEN is a scale from 0 to 1 in which 0 means completely closed and 1 means completely
open. The countries are analyzed and put on the scale, then you can easily see how open or how
closed a country is.
2.1.2.2 Measuring de facto
Measuring the de facto perspective is slightly more complicated. There are 3 ways of measuring de
facto, however only the first 2 are of importance for this lesson (3rd one next class):
1. Based on flows (based on the financial account of the balance of payments)
2. Based on stocks (based on the net foreign assets)
3. Based on price indicators (based on parity rations between inflation rates, exchange rates and
interest rates)
Based on flows
Flows are found on the financial account of the balance of payments (FDI, portfolio, foreign loans, et
cetera). When you observe the financial account, you can see how much flows are occurring in reality
and you can measure the intensity of these flows.
In case you want to compare these flows, it may be more useful to use ratios. This because the total
amount of flows will not always be as reliable, especially when you compare a small country with a
large country (the amount of flows of the small country will logically be lower). Ratios can be
expressed in for instance: GDP, Exports or per capita (population).
An example of a ratio could be: total capital flows / GDP.
Furthermore, it is possible to subdivide total capital flows. There are 4 different flows on the financial
account: FDI, portfolio investment, loans and foreign exchange result. Important however is the
difference between gross and net flows, the net concept gives you the net inflows.
Gross concept = inflow + outflows
Net concept = inflows – outflows
10