100% tevredenheidsgarantie Direct beschikbaar na je betaling Lees online óf als PDF Geen vaste maandelijkse kosten
logo-home
MATH 225N – MATH CHAMBERLAIN COLLEGE OF NURSING 2024 UPDATE QUESTIONS AND VERIFIED ACCURATE SOLUTIONS WITH EXPLANATION CHAMBERLAIN UNIVERSITY GRADED A+ €25,01
In winkelwagen

Tentamen (uitwerkingen)

MATH 225N – MATH CHAMBERLAIN COLLEGE OF NURSING 2024 UPDATE QUESTIONS AND VERIFIED ACCURATE SOLUTIONS WITH EXPLANATION CHAMBERLAIN UNIVERSITY GRADED A+

1 beoordeling
 3 keer verkocht
  • Vak
  • MATH 225N – MATH CHAMBERLAIN COLLEGE OF NURSING 20
  • Instelling
  • MATH 225N – MATH CHAMBERLAIN COLLEGE OF NURSING 20

MATH 225N – MATH CHAMBERLAIN COLLEGE OF NURSING 2024 UPDATE QUESTIONS AND VERIFIED ACCURATE SOLUTIONS WITH EXPLANATION CHAMBERLAIN UNIVERSITY GRADED A+

Voorbeeld 4 van de 54  pagina's

  • 29 januari 2024
  • 54
  • 2023/2024
  • Tentamen (uitwerkingen)
  • Vragen en antwoorden
  • MATH 225N – MATH CHAMBERLAIN COLLEGE OF NURSING 20
  • MATH 225N – MATH CHAMBERLAIN COLLEGE OF NURSING 20

1  beoordeling

review-writer-avatar

Door: ksbell77 • 7 maanden geleden

reply-writer-avatar

Door: Tutordiligent • 7 maanden geleden

Thank you very much for the review.

avatar-seller
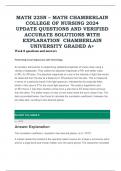
MATH 225N – MATH CHAMBERLAIN COLLEGE OF NURSING 2024 UPDATE QUESTIONS AND VERIFIED ACCURATE SOLUTIONS WITH EXPLANATION CHAMBERLAIN UNIVERSITY GRADE D A+ Week 8 questions and answers Performing Linear Regressions with Technology An amateur astronomer is researching statistical properties of known stars using a variety of databases. They collect the absolute magnitude or MV and stellar mass or M⊙ for 30 stars. The absolute magnitude of a star is the intensity of light that would be observed from the star at a distance of 10 parsecs from the star. This is measured in terms of a particular band of the light spectrum, indicated by the subscript lett er, which in this case is V for the visual light spectrum. The scale is logarithmic and an MV that is 1 less than another comes from a star that is 10 times more luminous than the other. The stellar mass of a star is how many times the sun's mass it has. The data is provided below. Use Excel to calculate the correlation coefficient r between the two data sets, rounding to two decimal places. Correct! You nailed it. r= −0.93 Answer Explanation The correlation coefficient, rounded to two decimal places, is r≈−0.93 . A market researcher looked at the quarterly sales revenue for a large e -commerce store and for a large brick -and-mortar retailer over the same period. The rese archer recorded the revenue in millions of dollars for 30 quarters. The data are provided below. Use Excel to calculate the correlation coefficient r between the two data sets. Round your answer to two decimal places. Yes that's right. Keep it up! r= −0.81 Answer Explanation The correlation coefficient, rounded to two decimal places, is r≈−0.81 . The table below contains the geographic latitudes, x, and average January temperatures, y, of 20cities. Use Excel to find the best fit linear regression equation. Round the slope and intercept to two decimal places. x y 46 23 32 60 39 40 33 59 38 57 40 33 42 33 30 64 34 56 HelpCopy to ClipboardDownload CSV Yes that's right. Keep it up! y = −2.68 , x147.24 Thus, the equation of line of best fit with slope and in tercept rounded to two decimal places is yˆ=−2.68 x+147.24 . An organization collects information on the life expectancy (in years) of a person in certain countries and the fertility rate per woman in those countries. The data for 21 randomly selected countr ies for the year 2011 is given below. Use Excel to find the best fit linear regression equation, where fertility rate is the explanatory variable. Round the slope and intercept to two decimal places. y = −4.21 , x 83.68 Answer Explanation yˆ=−4.21 , x+83.6 8. An economist is trying to understand whether there is a strong link between CEO pay ratio and corporate revenue. The economist gathered data including the CEO pay ratio and corporate revenue for 30 companies for a particular year. The pay ratio data is reported by the companies and represents the ratio of CEO compensation to the median employee salary. The data are provided below. Use Excel to calculate the correlation coefficient r between the two data sets. Round your answer to two decimal places. Perfect. Your hard work is paying off 😀 r= −0.17 The correlation coefficient, rounded to two decimal places, is r≈−0.17 . A researcher is interested in whether the variation in the size of human beings is proportional throughout each part of the human. To p artly answer this question they looked at the correlation between the foot length (in millimeters) and height (in centimeters) of 30 randomly selected adult males. The data is provided below. Use Excel to calculate the correlation coefficient r between the two data sets. Round your answer to two decimal places. Great work! That's correct. r= 0.50 The correlation coefficient, rounded to two decimal places, is r≈0.50 . The table below gives the average weight (in kilograms) of certain people ages 1–20. Use Excel to find the best fit linear regression equation, where age is the explanatory variable. Round the slope and intercept to two decimal places. Answer 1: That's not right - let's review the answer. y = 0.35, x28.99 Answer 2: Well done! You got it right. y = 2.89, x 4.69 Thus, the equation of line of best fit with slope and intercept rounded to two decimal places is yˆ=2.86 x+4.69 . In the following table, the age (in years) of the respondents is given as the x value, and the earnings (in thousands of dollars) of the respondents are given as the y value. Use Excel to find the best fit linear regression equation in thousands of dollars. Round the slope and intercept to three decimal places. Yes that's right. Keep it up! y = 0.433 , x=24.493 Answer Explanation Thus, the equation of line of best fit with slope and intercept rounded to three decimal places is yˆ=0.433 x+24.493 . PREDICITONS USING LINEAR REGRESSION Question The table shows data collected on the relationship between the time spent studying per day and the time spent reading per day. The line of best fit for the data is yˆ=0.16 x+36.2 . Assume the line of best fit is significant and there is a strong linear relationship between the variables.

Dit zijn jouw voordelen als je samenvattingen koopt bij Stuvia:

Bewezen kwaliteit door reviews

Bewezen kwaliteit door reviews

Studenten hebben al meer dan 850.000 samenvattingen beoordeeld. Zo weet jij zeker dat je de beste keuze maakt!

In een paar klikken geregeld

In een paar klikken geregeld

Geen gedoe — betaal gewoon eenmalig met iDeal, creditcard of je Stuvia-tegoed en je bent klaar. Geen abonnement nodig.

Direct to-the-point

Direct to-the-point

Studenten maken samenvattingen voor studenten. Dat betekent: actuele inhoud waar jij écht wat aan hebt. Geen overbodige details!

Veelgestelde vragen

Wat krijg ik als ik dit document koop?

Je krijgt een PDF, die direct beschikbaar is na je aankoop. Het gekochte document is altijd, overal en oneindig toegankelijk via je profiel.

Tevredenheidsgarantie: hoe werkt dat?

Onze tevredenheidsgarantie zorgt ervoor dat je altijd een studiedocument vindt dat goed bij je past. Je vult een formulier in en onze klantenservice regelt de rest.

Van wie koop ik deze samenvatting?

Stuvia is een marktplaats, je koop dit document dus niet van ons, maar van verkoper Tutordiligent. Stuvia faciliteert de betaling aan de verkoper.

Zit ik meteen vast aan een abonnement?

Nee, je koopt alleen deze samenvatting voor €25,01. Je zit daarna nergens aan vast.

Is Stuvia te vertrouwen?

4,6 sterren op Google & Trustpilot (+1000 reviews)

Afgelopen 30 dagen zijn er 68175 samenvattingen verkocht

Opgericht in 2010, al 15 jaar dé plek om samenvattingen te kopen

Begin nu gratis
€25,01  3x  verkocht
  • (1)
In winkelwagen
Toegevoegd